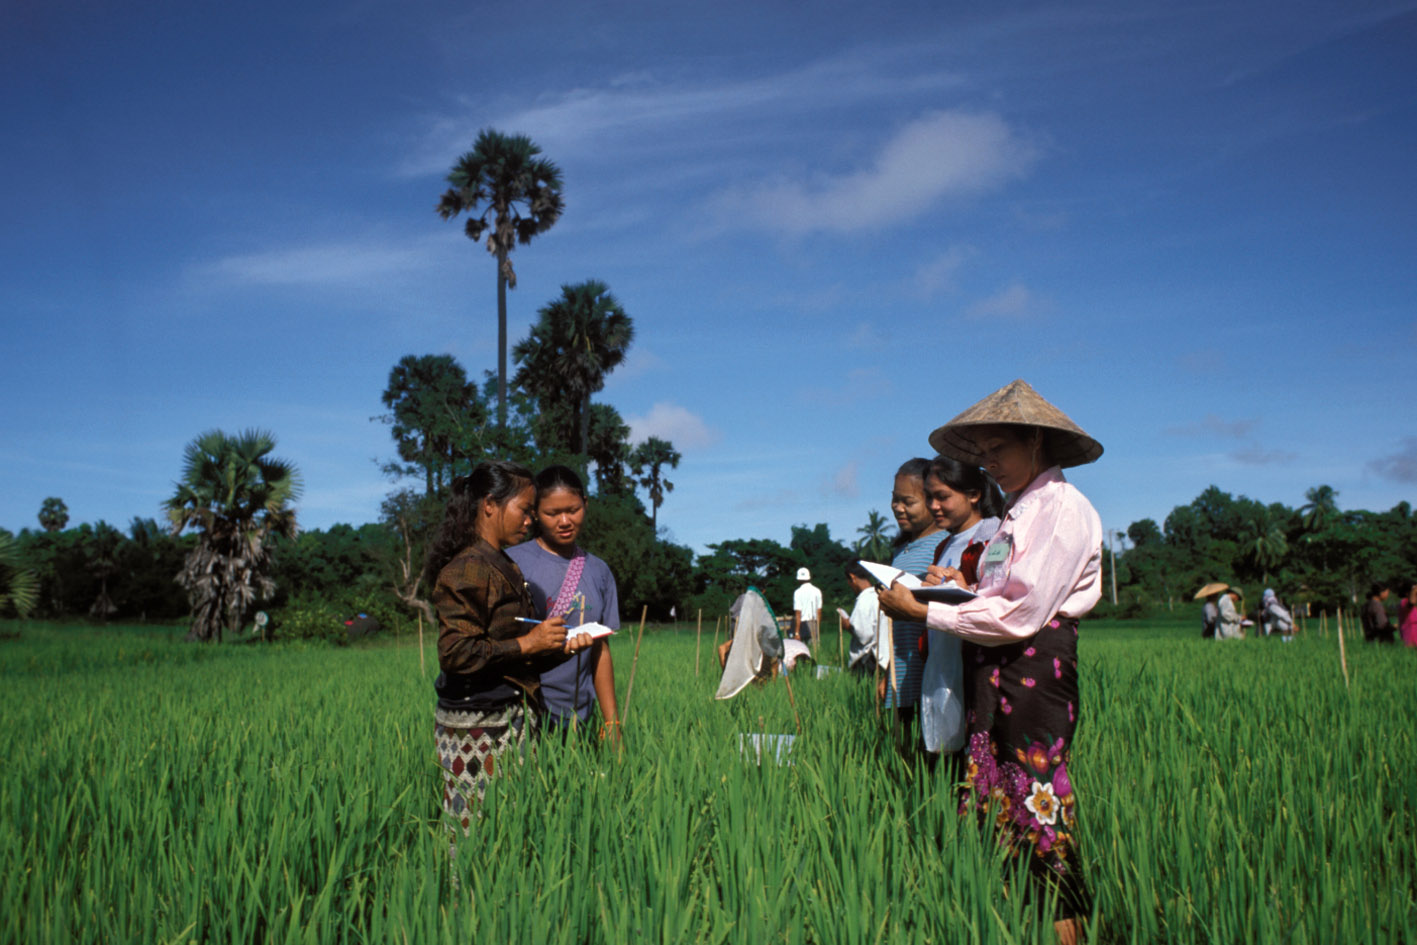
Conservation Agriculture 2009-2011
Malawi, 2009 - 2011
Get Microdata
Reference ID
MWI_2009-2011_CA_v01_EN_M_v01_A_OCS
Producer(s)
Ariel BenYishay, A. Mushfiq Mobarak
Collections
Metadata
Created on
Sep 10, 2020
Last modified
Nov 08, 2022
Page views
133005
Downloads
476
- Data files
- ADP_ML_Cleaned
-
midline_vfg_17
Jun
2011_nonames
C05 Agricultural Challenge 2 (c05)
Data file: midline_vfg_17 Jun 2011_nonames
Overview
Valid:
206
Invalid:
0
Type:
Discrete
Decimal:
0
Start:
196
End:
197
Width:
2
Range:
-9 - 7
Format:
Numeric
Questions and instructions
Categories
| Value | Category | Cases | |
|---|---|---|---|
| -9 | 8 |
3.9%
|
|
| 1 | lack of inputs | 36 |
17.5%
|
| 2 | poor rainfall | 48 |
23.3%
|
| 3 | lack of techniques / technologies | 20 |
9.7%
|
| 4 | poor access to markets | 18 |
8.7%
|
| 5 | pests | 12 |
5.8%
|
| 6 | low prices for crops | 46 |
22.3%
|
| 7 | lack of access to credit / finance | 18 |
8.7%
|
Warning: these figures indicate the number of cases found in the data file. They cannot be interpreted as summary statistics of the population of interest.
