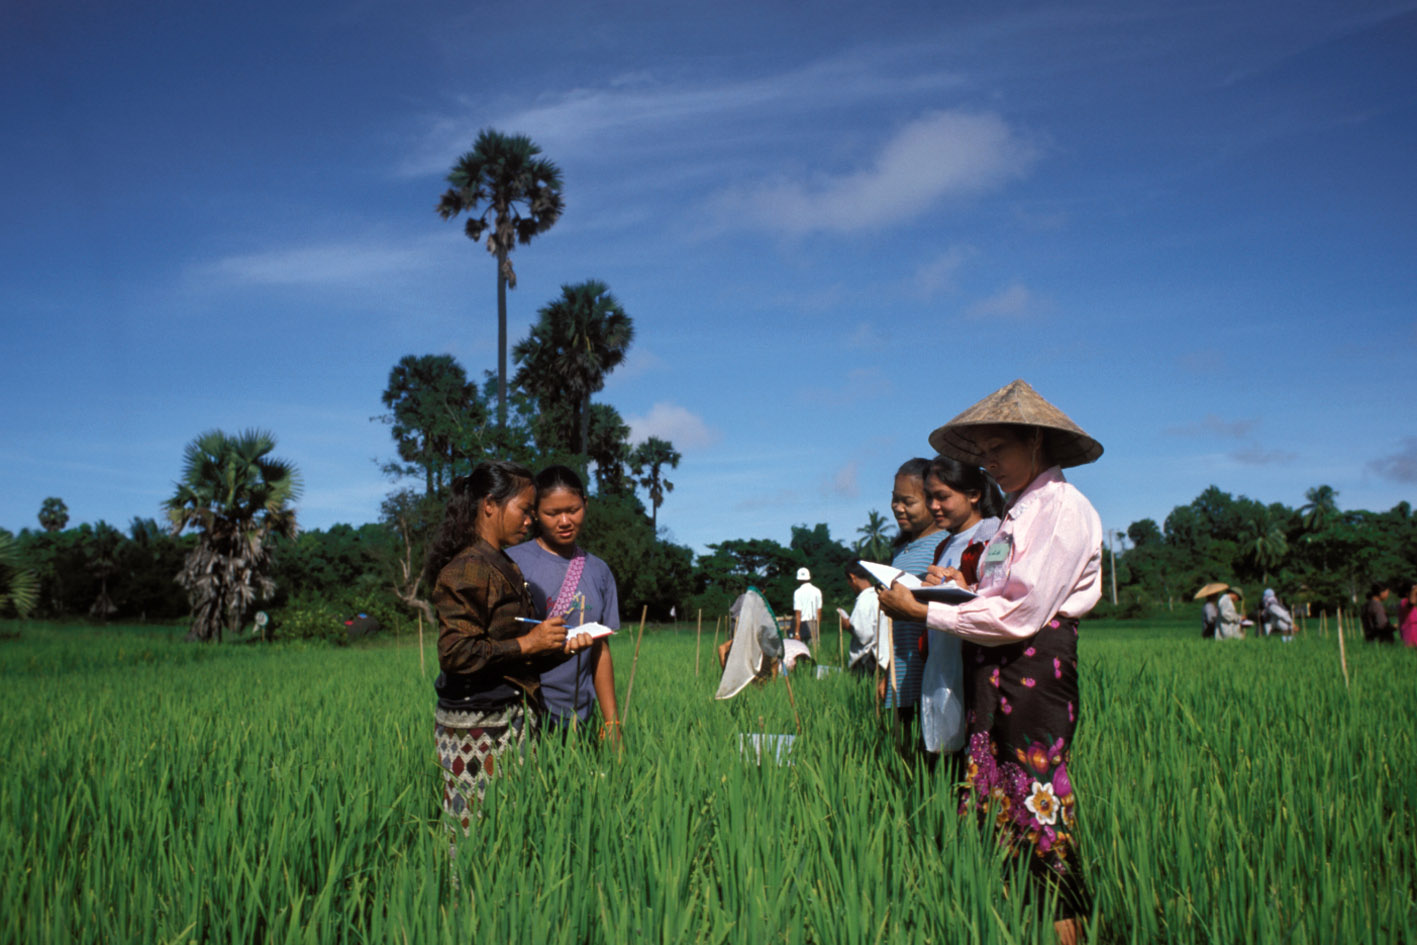
Rural Capacity Building Project, Baseline Survey 2009
Ethiopia, 2009
Get Microdata
Reference ID
ETH_2009_RCBP-BS_v01_EN_M_v01_A_OCS
Producer(s)
Tigist Ketema, Niklas Buehren
Collections
Metadata
Created on
Sep 10, 2020
Last modified
Nov 08, 2022
Page views
60562
Downloads
318
- Data files
- IDENTI_1
- Section_A
- Section_B
- Section_C
- Section_C_Consumption
- Section_C2
- D0_D3
- D4_16
- D6_Head
- D6_Spouse
- D8_Head
- D8_Spouse
- D10_H
- D10_S
- D12_H
- D12_S
- D14_H
- D14_S
- D16_H
- D16_S
- D17_D
- D19_H
- D19_S
- D24_D65
- D31_Head
- D31_Spouse
- D37_Head
- D37_Spouse
- D41_Head
- D41_Spouse
- D47_Head
- D47_Spouse
- D48_Head
- D48_Spouse
- D49_Head
- D49_Spouse
- D51_Head
- D51_Spouse
- E1_E2
- E3_E9
- E9
- E10_E19
- E20_E27
- E28_E36
- F0
- F1_F22
- F23_F30
- Farm Input
food type (ft)
Data file: Section_C_Consumption
Overview
Valid:
15522
Invalid:
1
Type:
Discrete
Decimal:
0
Start:
7
End:
8
Width:
2
Range:
1 - 55
Format:
Numeric
Questions and instructions
Literal question
Section C: Consumption
Food Type
Food Type
Categories
| Value | Category | Cases | |
|---|---|---|---|
| 1 | teff | 884 |
5.7%
|
| 2 | barley | 480 |
3.1%
|
| 3 | wheat | 632 |
4.1%
|
| 4 | maize | 948 |
6.1%
|
| 5 | sorghum | 579 |
3.7%
|
| 6 | millet | 226 |
1.5%
|
| 7 | rice | 85 |
0.5%
|
| 8 | lentils | 256 |
1.6%
|
| 9 | horse beans/fava beans | 843 |
5.4%
|
| 10 | peas/field peas | 484 |
3.1%
|
| 11 | chick peas | 243 |
1.6%
|
| 12 | haricort beans | 232 |
1.5%
|
| 13 | beef | 294 |
1.9%
|
| 14 | mutton | 52 |
0.3%
|
| 15 | camel meet | 37 |
0.2%
|
| 16 | chicken | 66 |
0.4%
|
| 17 | egg | 267 |
1.7%
|
| 18 | milk (cow, goat, camel) | 360 |
2.3%
|
| 19 | potato/sweet potato | 634 |
4.1%
|
| 20 | cassava/boyna/boye | 92 |
0.6%
|
| 21 | enset/kocho | 131 |
0.8%
|
| 22 | amicho/bula | 71 |
0.5%
|
| 23 | onion | 1289 |
8.3%
|
| 24 | gommen/cabbage head | 419 |
2.7%
|
| 25 | spaghetti/macaroni | 162 |
1%
|
| 26 | butter or oil | 1307 |
8.4%
|
| 27 | coffee | 1414 |
9.1%
|
| 28 | sugar | 922 |
5.9%
|
| 29 | tella/tej/arakie/katikala/beer | 488 |
3.1%
|
| 30 | other beverages | 80 |
0.5%
|
| 31 | pepper | 478 |
3.1%
|
| 32 | green pepper | 21 |
0.1%
|
| 33 | latijrus | 21 |
0.1%
|
| 34 | wheat and barley mix | 1 |
0%
|
| 35 | _kenkos_ | 88 |
0.6%
|
| 36 | lupine | 1 |
0%
|
| 37 | tomato | 55 |
0.4%
|
| 38 | salt | 817 |
5.3%
|
| 39 | local beer | 0 |
0%
|
| 40 | soya bean | 4 |
0%
|
| 41 | mango | 0 |
0%
|
| 42 | pineapple | 0 |
0%
|
| 43 | spice | 9 |
0.1%
|
| 44 | ginger | 1 |
0%
|
| 45 | garlic | 9 |
0.1%
|
| 46 | coffee husk | 2 |
0%
|
| 47 | ethiopian hops | 6 |
0%
|
| 48 | banana | 6 |
0%
|
| 49 | roman | 1 |
0%
|
| 50 | bred | 13 |
0.1%
|
| 51 | haricot bean | 2 |
0%
|
| 52 | sesame | 3 |
0%
|
| 53 | orange | 1 |
0%
|
| 54 | lemon | 1 |
0%
|
| 55 | other | 5 |
0%
|
| Sysmiss | 1 |
Warning: these figures indicate the number of cases found in the data file. They cannot be interpreted as summary statistics of the population of interest.
