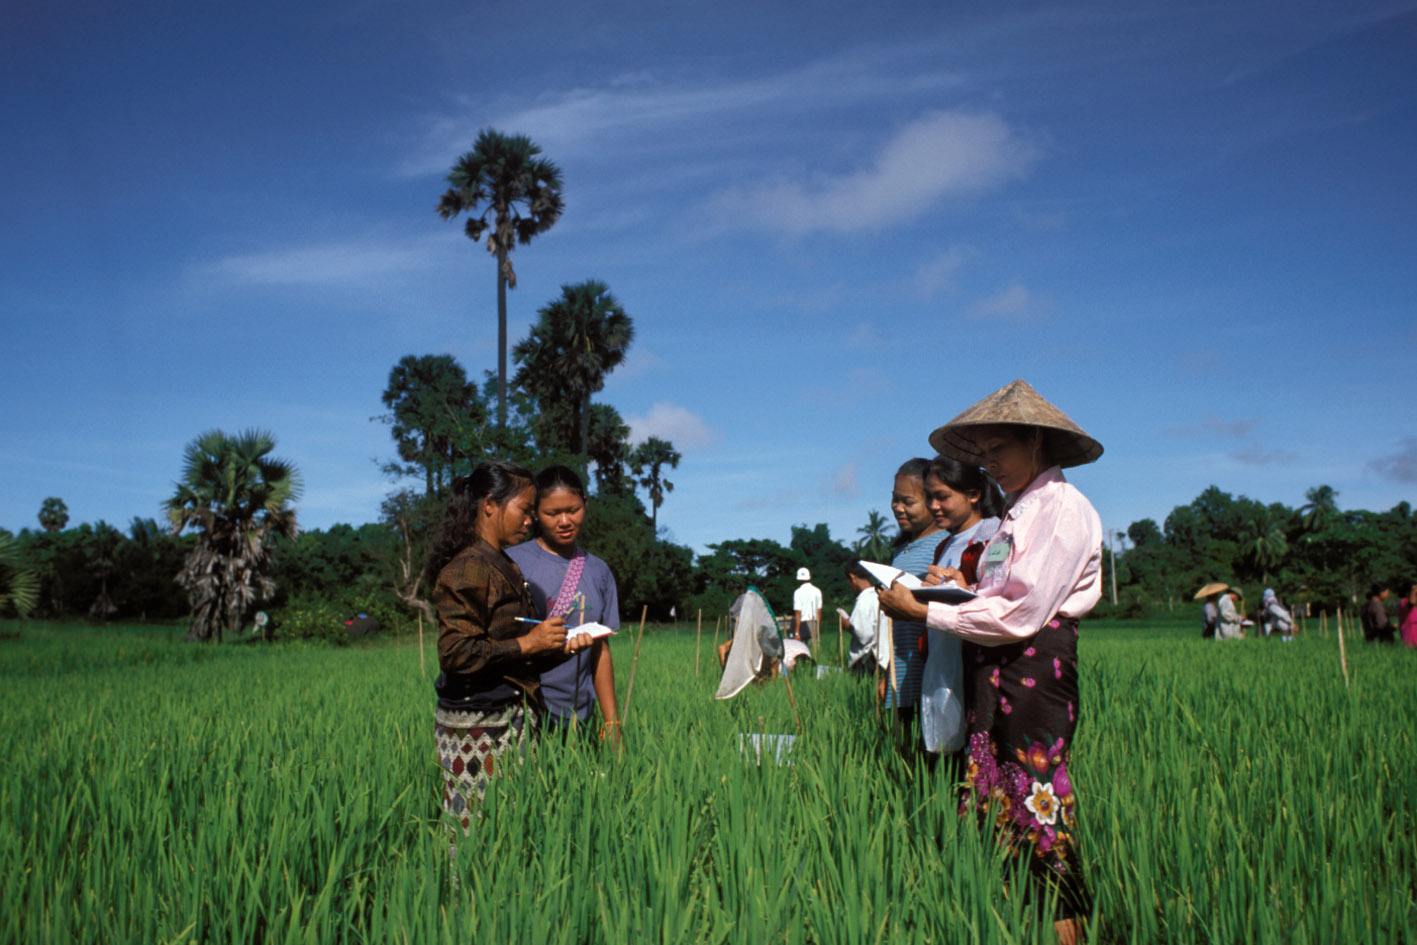
Living Standards Survey 2001
Timor-Leste, 2001
Get Microdata
Reference ID
TLS_2001_LSS-W1_v01_EN_M_v01_A_OCS
Producer(s)
National Statistics Directorate
Collections
Metadata
Created on
Oct 15, 2020
Last modified
Nov 08, 2022
Page views
71359
Downloads
603
- Data files
- S00
- S01A1
- S01A2
- S01A3
- S01B1
- S01B2
- S01C1
- S01C2
- S01D
- S02A
- S02B
- S02C
- S02D1
- S02D2
- S03
- S04A
- S04B
- S04C1
- S04C2
- S05A
- S05B1
- S05B2
- S05B3
- S05B4
- S05B5
- S06A1
- S06A2
- S06A3
- S06A4
- S06A5
- S06B1
- S06B2
- S08A1
- S08A2
- S08B1
- S08B2
- S08B3
- S08B4
- S08B5
- S08B6
- S08B7
- S08C
- S09A1
- S09A2
- S09A3
- S09A4
- S09A5
- S09B1
- S09B2
- S09C1
- S09C2
- S09D1
- S09D2
- S09E1
- S09E2
- S09E3
- S09F1
- S09F2
- S09F3
- S09F4
- S09G1
- S09G2
- S09G3
- S09H1
- S09H2
- S09H3
- S09H4
- S09H5
- S09H6
- S10A1
- S10A2
- S10B1
- S10B2
- S10C
- S10D1
- S10D2
- S10E1
- S10E2
- S13A
- S13B
- S13C
- S071
- S072
- S111
- S112
- S121
- S122
- CALORIES
- WEIGHT
30 why not attending/planning to attend school in 2001/02 (s05b30)
Data file: S05B5
Overview
Valid:
97
Invalid:
2388
Type:
Discrete
Decimal:
0
Width:
21
Range:
1 - 20
Format:
Numeric
Questions and instructions
Categories
| Value | Category | Cases | |
|---|---|---|---|
| 1 | Below school age | 1 |
1%
|
| 2 | Completed studies | 6 |
6.2%
|
| 3 | Too old | 2 |
2.1%
|
| 4 | Too expensive | 17 |
17.5%
|
| 5 | No interest | 5 |
5.2%
|
| 6 | Agricultural work | 7 |
7.2%
|
| 7 | Work at home | 4 |
4.1%
|
| 8 | Other work | 6 |
6.2%
|
| 9 | School too far | 7 |
7.2%
|
| 10 | No teacher | 0 |
0%
|
| 11 | No supplies | 0 |
0%
|
| 12 | School not functional | 0 |
0%
|
| 13 | Illness | 2 |
2.1%
|
| 14 | Family illness/death | 0 |
0%
|
| 15 | Displaced | 5 |
5.2%
|
| 16 | Safety | 3 |
3.1%
|
| 17 | Harassment | 2 |
2.1%
|
| 18 | Language | 0 |
0%
|
| 19 | Got married | 16 |
16.5%
|
| 20 | Other | 14 |
14.4%
|
| Sysmiss | 2388 |
Warning: these figures indicate the number of cases found in the data file. They cannot be interpreted as summary statistics of the population of interest.
