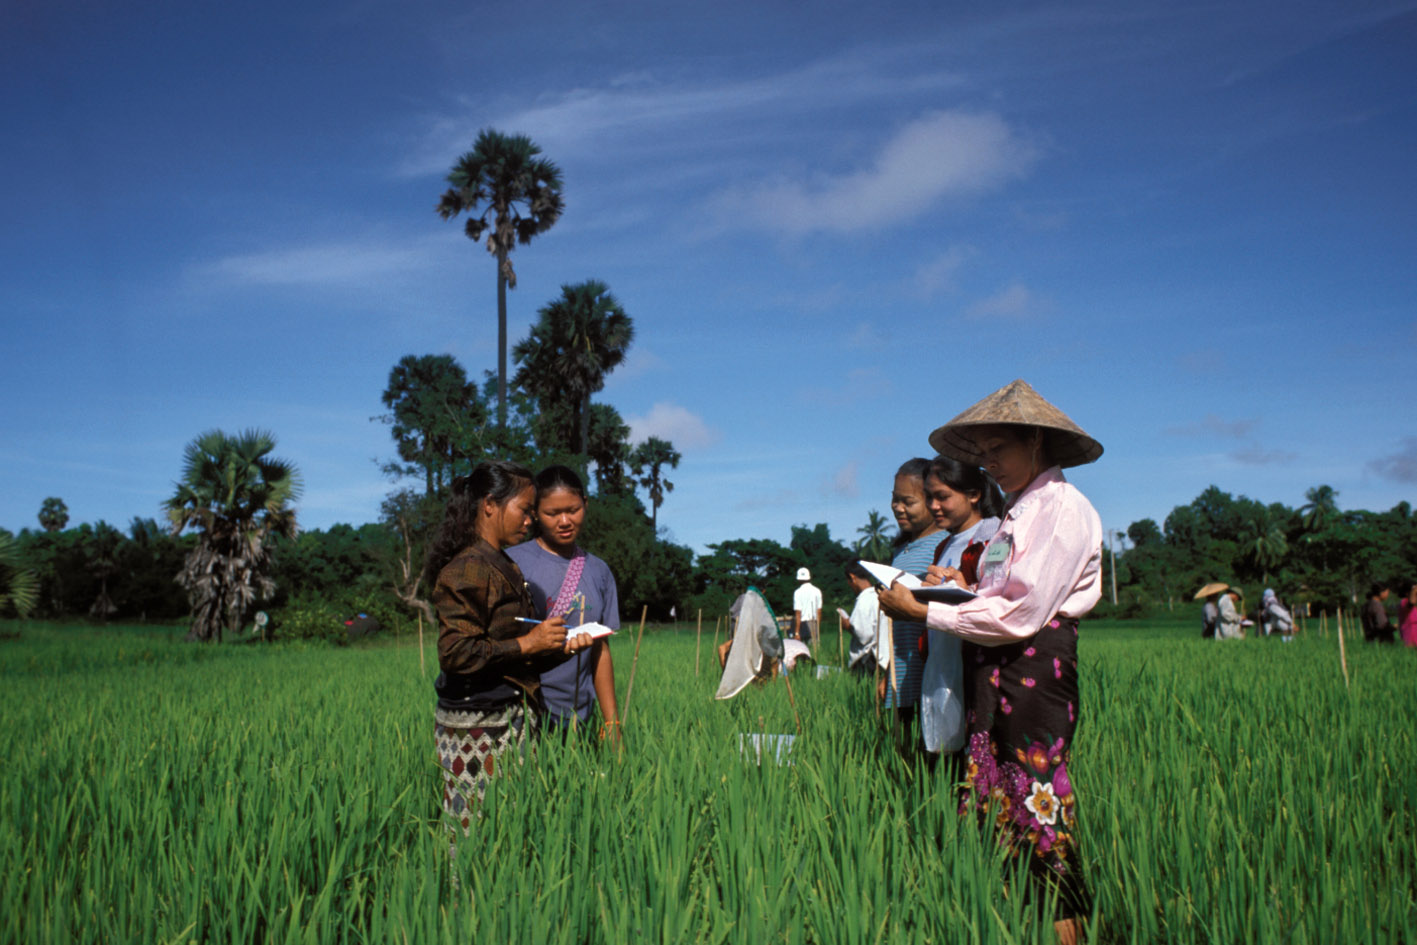
Smallholder Household Survey - CGAP, 2016
United Republic of Tanzania, Zanzibar, 2016
Get Microdata
Reference ID
TZA_2016_SHS_v01_EN_M_v01_A_OCS
Producer(s)
Jamie Anderson
Collections
Metadata
Created on
Oct 20, 2020
Last modified
Nov 08, 2022
Page views
21994
Downloads
177
District (I9)
Data file: cgap_smallholder_household_survey_tza_2015_multiple_may_16
Overview
Valid:
5034
Invalid:
-
Minimum:
1
Maximum:
137
Type:
Discrete
Range:
-
Format:
Numeric
Questions and instructions
Literal question
District Name
Categories
| Value | Category |
|---|---|
| 1 | Arusha |
| 2 | Arusha Mjini |
| 3 | Babati |
| 4 | Babati Mji |
| 5 | Bagamoyo |
| 6 | Bahi |
| 7 | Bariadi |
| 8 | Biharamulo |
| 9 | Buhigwe |
| 10 | Bukoba |
| 11 | Bukoba Manispaa |
| 12 | Bunda |
| 13 | Busega |
| 14 | Butiama |
| 15 | Chake Chake |
| 16 | Chamwino |
| 17 | Chato |
| 18 | Chemba |
| 19 | Chunya |
| 20 | Dodoma Mjini |
| 21 | Gairo |
| 22 | Geita |
| 23 | Hai |
| 24 | Hanang |
| 25 | Handeni |
| 26 | Igunga |
| 27 | Ikungi |
| 28 | Ilala |
| 29 | Ileje |
| 30 | Ilemela Manispaa |
| 31 | Iramba |
| 32 | Iringa |
| 33 | Iringa Manispaa |
| 34 | Itilima |
| 35 | Kahama |
| 36 | Kahama Mji |
| 37 | Kakonko |
| 38 | Kalambo |
| 39 | Kaliua |
| 40 | Karagwe |
| 41 | Karatu |
| 42 | Kaskazini B |
| 43 | Kasulu |
| 44 | Kasulu Mji |
| 45 | Kibondo |
| 46 | Kigoma |
| 47 | Kigoma Manispaa |
| 48 | Kilindi |
| 49 | Kilolo |
| 50 | Kilombero |
| 51 | Kilosa |
| 52 | Kilwa |
| 53 | Kinondoni |
| 54 | Kisarawe |
| 55 | Kishapu |
| 56 | Kiteto |
| 57 | Kondoa |
| 58 | Kongwa |
| 59 | Korogwe |
| 60 | Korogwe Mjini |
| 61 | Kwimba |
| 62 | Kyela |
| 63 | Kyerwa |
| 64 | Lindi |
| 65 | Lindi Manispaa |
| 66 | Ludewa |
| 67 | Lushoto |
| 68 | Mafia |
| 69 | Magharibi |
| 70 | Magu |
| 71 | Makete |
| 72 | Manyoni |
| 73 | Masasi |
| 74 | Maswa |
| 75 | Mbarali |
| 76 | Mbeya |
| 77 | Mbeya Jiji |
| 78 | Mbinga |
| 79 | Mbogwe |
| 80 | Mbozi |
| 81 | Mbulu |
| 82 | Meatu |
| 83 | Meru |
| 84 | Missenyi |
| 85 | Misungwi |
| 86 | Mjini |
| 87 | Mkalama |
| 88 | Mlele |
| 89 | Momba |
| 90 | Monduli |
| 91 | Morogoro |
| 92 | Morogoro Manispaa |
| 93 | Moshi |
| 94 | Mpanda |
| 95 | Mpwapwa |
| 96 | Mtwara Manispaa |
| 97 | Mtwara Vijijini |
| 98 | Mufindi |
| 99 | Muheza |
| 100 | Muleba |
| 101 | Mvomero |
| 102 | Mwanga |
| 103 | Nachingwea |
| 104 | Namtumbo |
| 105 | Nanyumbu |
| 106 | Newala |
| 107 | Ngara |
| 108 | Ngorongoro |
| 109 | Nkasi |
| 110 | Nyamagana Manispaa |
| 111 | Nzega |
| 112 | Rombo |
| 113 | Rorya |
| 114 | Ruangwa |
| 115 | Rufiji |
| 116 | Rungwe |
| 117 | Same |
| 118 | Sengerema |
| 119 | Serengeti |
| 120 | Shinyanga Manispaa |
| 121 | Siha |
| 122 | Singida |
| 123 | Sinyanga |
| 124 | Songea Manispaa |
| 125 | Sumbawanga |
| 126 | Tabora Manispaa |
| 127 | Tandahimba |
| 128 | Tarime |
| 129 | Temeke |
| 130 | Tunduru |
| 131 | Ukerewe |
| 132 | Ulanga |
| 133 | Urambo |
| 134 | Uvinza |
| 135 | Uyui |
| 136 | Wang'ing'ombe |
| 137 | Wangingombe |
Warning: these figures indicate the number of cases found in the data file. They cannot be interpreted as summary statistics of the population of interest.
Description
Source of information
District
Imputation and derivation
Imputation
District
Others
Security
District
