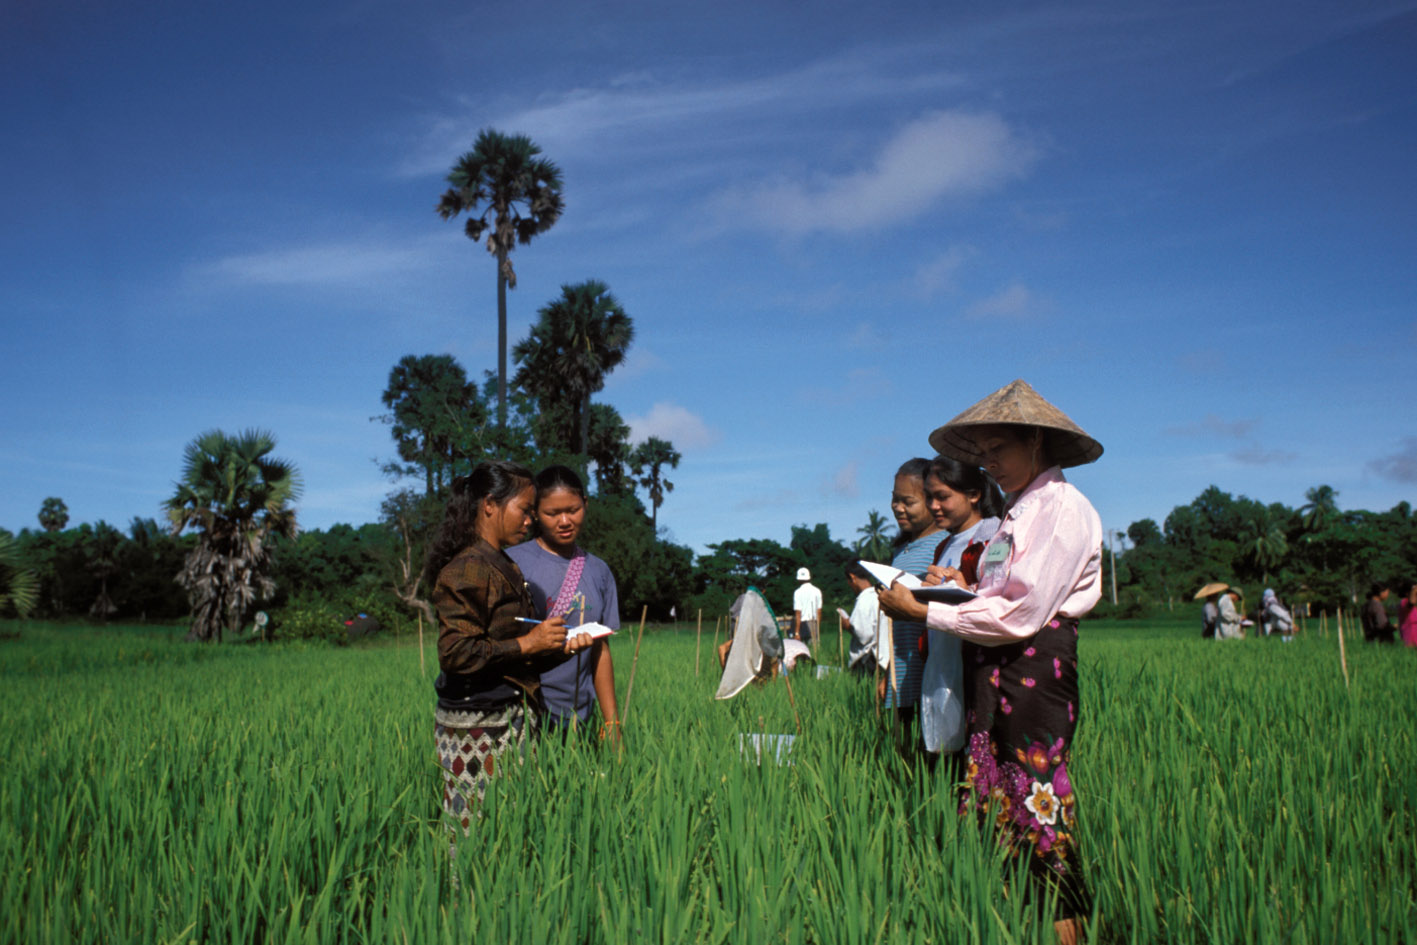
Good Growth Plan, 2014-2019
Italy, 2014 - 2019
Get Microdata
Reference ID
ITA_2014-2019_GGP-P_v01_EN_M_A_OCS
Producer(s)
Syngenta
Collections
Metadata
Created on
Feb 16, 2021
Last modified
Feb 16, 2021
Page views
24116
Downloads
1067
Q4000b. Can you please tell us what are your main sources for selling the harvest? Other. Specify 1 (q4000_oth1)
Data file: global_farm_data_country_ITA
Overview
Valid:
226
Invalid:
0
Type:
Discrete
Width:
50
Range:
-
Format:
character
Questions and instructions
Categories
| Value | Category | Cases | |
|---|---|---|---|
| autoconsumo interno | 1 |
0.4%
|
|
| cantina privata | 2 |
0.9%
|
|
| centro di raccolta privato | 2 |
0.9%
|
|
| imbottiglia | 2 |
0.9%
|
|
| imbottigliato | 4 |
1.8%
|
|
| imbottigliato in proprio e venduto in azienda | 2 |
0.9%
|
|
| imbottiglilamento | 2 |
0.9%
|
|
| la stocco in attesa che aumenti il prezzo | 2 |
0.9%
|
|
| la trasformo in vino | 2 |
0.9%
|
|
| la vendo a un privato | 1 |
0.4%
|
|
| lo vendo ad un'azienda | 1 |
0.4%
|
|
| non vendo | 45 |
19.9%
|
|
| privati | 8 |
3.5%
|
|
| stoccata per vendere quando aumenta il prezzo | 1 |
0.4%
|
|
| stoccatore | 1 |
0.4%
|
|
| stocco in attesa che aumenti il prezzo | 3 |
1.3%
|
|
| trasformo ni vino | 2 |
0.9%
|
|
| uso in azienda | 1 |
0.4%
|
|
| uso per cucinare prodotti che rivendo direttamente | 2 |
0.9%
|
|
| uso proprio alimentazione animale | 2 |
0.9%
|
|
| vendemmiatrice | 2 |
0.9%
|
|
| vendita a privato | 1 |
0.4%
|
|
| vendita diretta | 1 |
0.4%
|
|
| vendo ad un biogas | 1 |
0.4%
|
|
| vendo al consorzio | 6 |
2.7%
|
|
| vendo per impianto biogas | 1 |
0.4%
|
|
| venduta impianto biogas | 1 |
0.4%
|
|
| venduta in azienda | 2 |
0.9%
|
|
| venduta la consorzio | 2 |
0.9%
|
|
| venduto a un consorzio | 1 |
0.4%
|
|
| venduto al produttore di semi | 1 |
0.4%
|
|
| venduto in azienda | 2 |
0.9%
|
|
| viene venduto nella nostra cantina | 2 |
0.9%
|
|
| vinificazione | 2 |
0.9%
|
|
| vinificio | 24 |
10.6%
|
|
| vinifico | 91 |
40.3%
|
Warning: these figures indicate the number of cases found in the data file. They cannot be interpreted as summary statistics of the population of interest.
