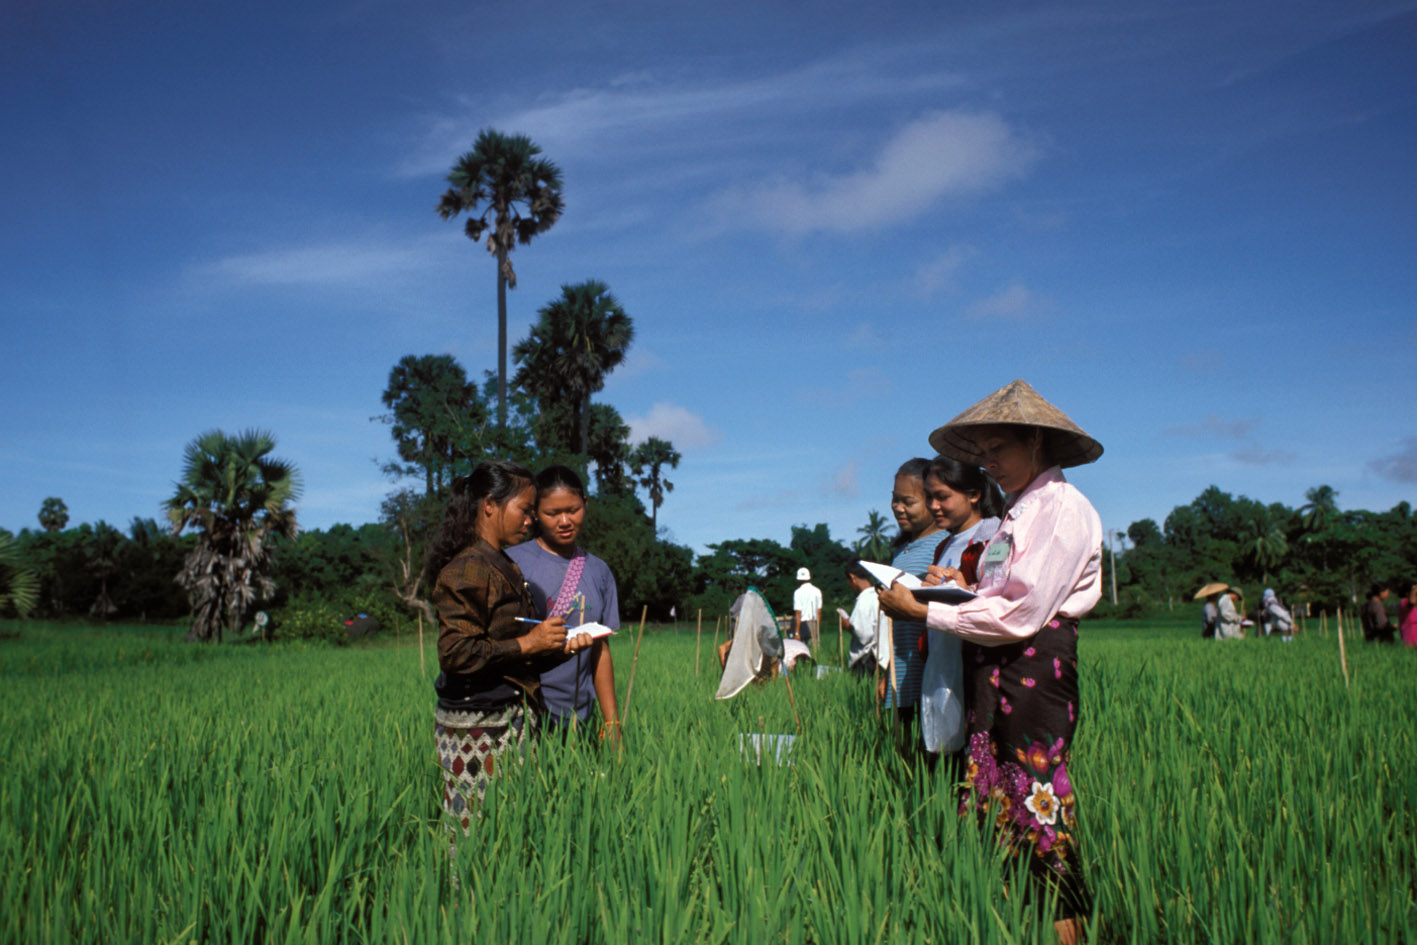
Integrated Household Living Conditions Survey, Wave 5, VUP, 2016-2017.
Rwanda, 2016 - 2017
Get Microdata
Reference ID
RWA_2016-2017_EICV-W5-VUP_v01_EN_M_v01_A_OCS
Producer(s)
National Institute of Statistics Rwanda (NISR)
Collections
Metadata
Created on
Mar 07, 2021
Last modified
Mar 07, 2021
Page views
50146
Downloads
382
- Data files
- VUP_Panel_for_merge
- vup_S0_S5_Household
- vup_S1_S2_S3_S4_S6A_S6E_Person
- vup_S5F_Access_to_services
- vup_S6B_Employement_6C_Salaried_S6D_Business
- vup_S7A1_livestock
- vup_S7A2_livestock
- vup_S7A3_livestock
- vup_S7A4_livestock
- vup_S7B1_land_Agriculture
- vup_S7B2_land_Agriculture
- vup_S7C_parcels
- vup_S7D_large_crop
- vup_S7E_small_crop
- vup_S7F_income_agriculture
- vup_S7G_expenditure_agriculture
- vup_S7H_transformation_agriculture
- vup_S8A1_expenditure
- vup_S8A2_expenditure
- vup_S8A3_expenditure
- vup_S8B_expenditure
- vup_S8C_farming
- vup_S9A_transfers_out
- vup_S9B_transfers_in
- vup_S9C_Vup_ubudehe_and_Rssp_schemes
- vup_S9C3_Vup_ubudehe_and_Rssp_schemes
- vup_S9C4_Vup_ubudehe_and_Rssp_schemes
- vup_S9D_other_income
- vup_S9E_Other_expenditure
- vup_S10A1_Credits
- vup_S10A2_Listing_of_credits
- vup_S10B1_Durable_household_goods
- vup_S10B2_Durable_household_goods
- vup_S10C1_Savings
- vup_S10C2_Tontine
District Name (district)
Data file: vup_S8A3_expenditure
Overview
Valid:
60828
Invalid:
0
Type:
Discrete
Decimal:
0
Start:
21
End:
22
Width:
2
Range:
11 - 57
Format:
Numeric
Questions and instructions
Categories
| Value | Category | Cases | |
|---|---|---|---|
| 11 | Nyarugenge | 3034 |
5%
|
| 12 | Gasabo | 6142 |
10.1%
|
| 13 | Kicukiro | 5772 |
9.5%
|
| 21 | Nyanza | 518 |
0.9%
|
| 22 | Gisagara | 1998 |
3.3%
|
| 23 | Nyaruguru | 1998 |
3.3%
|
| 24 | Huye | 962 |
1.6%
|
| 25 | Nyamagabe | 1443 |
2.4%
|
| 26 | Ruhango | 1850 |
3%
|
| 27 | Muhanga | 1739 |
2.9%
|
| 28 | Kamonyi | 518 |
0.9%
|
| 31 | Karongi | 1110 |
1.8%
|
| 32 | Rutsiro | 851 |
1.4%
|
| 33 | Rubavu | 814 |
1.3%
|
| 34 | Nyabihu | 1480 |
2.4%
|
| 35 | Ngororero | 999 |
1.6%
|
| 36 | Rusizi | 1480 |
2.4%
|
| 37 | Nyamasheke | 3626 |
6%
|
| 41 | Rulindo | 2775 |
4.6%
|
| 42 | Gakenke | 3367 |
5.5%
|
| 43 | Musanze | 2294 |
3.8%
|
| 44 | Burera | 2960 |
4.9%
|
| 45 | Gicumbi | 3219 |
5.3%
|
| 51 | Rwamagana | 1147 |
1.9%
|
| 52 | Nyagatare | 925 |
1.5%
|
| 53 | Gatsibo | 1776 |
2.9%
|
| 54 | Kayonza | 1221 |
2%
|
| 55 | Kirehe | 1628 |
2.7%
|
| 56 | Ngoma | 1850 |
3%
|
| 57 | Bugesera | 1332 |
2.2%
|
Warning: these figures indicate the number of cases found in the data file. They cannot be interpreted as summary statistics of the population of interest.
