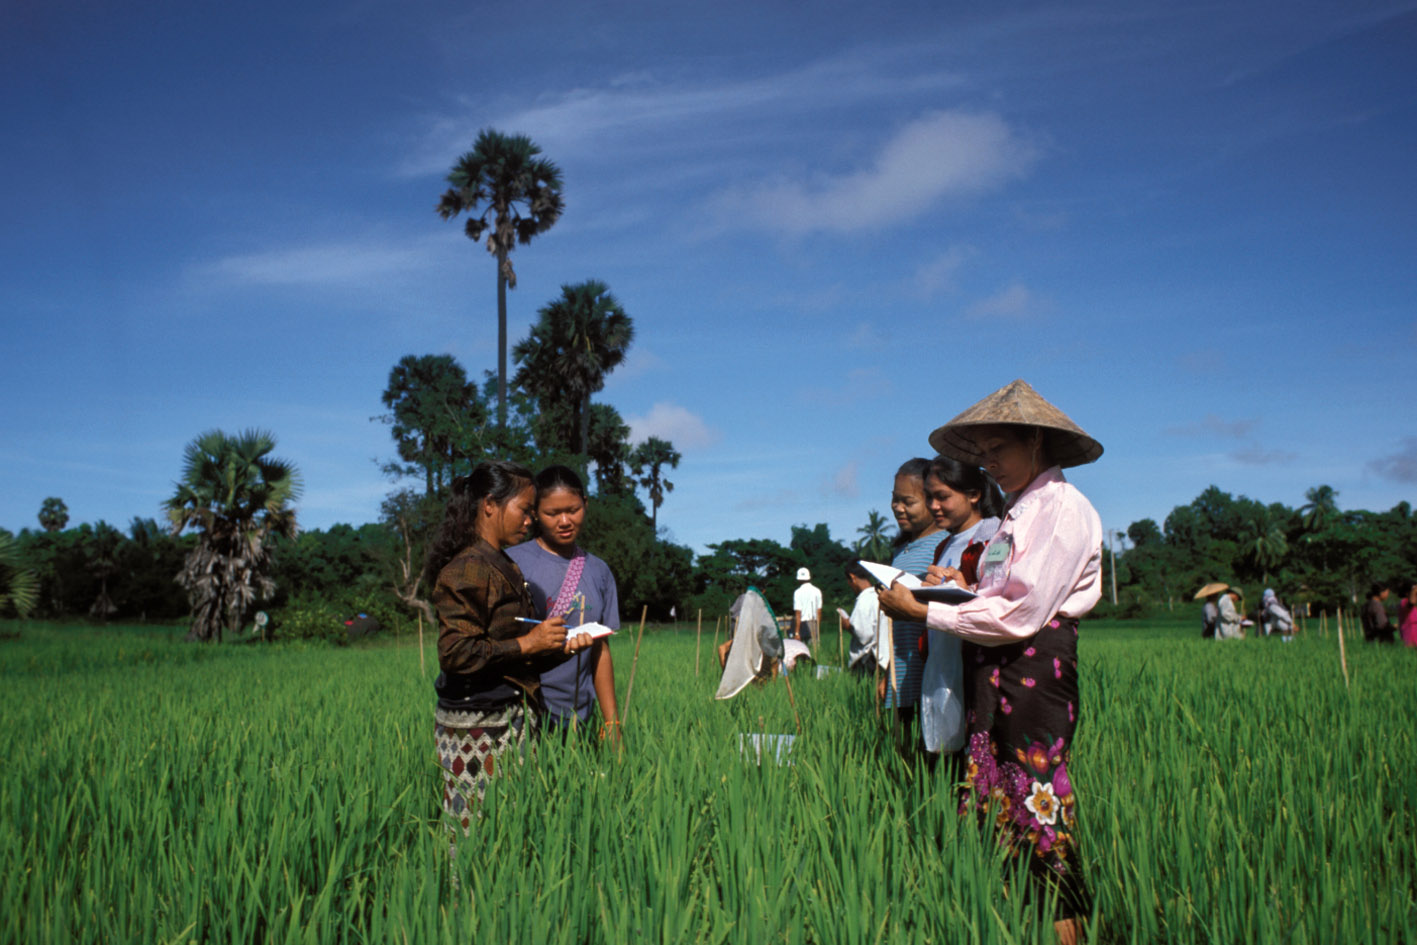
General Household Survey, 2008
Nigeria, 2009
Get Microdata
Reference ID
NGA_2008_GHS_v01_EN_M_v01_A_OCS
Producer(s)
National Bureau of Statistics (NBS)
Collections
Metadata
Created on
Mar 30, 2021
Last modified
Mar 30, 2021
Page views
21724
Downloads
432
- Data files
-
Part K
Household
Expenditure -
Part A
Identification -
Part B Persons
in the
Household -
Part C Usual
Residence
Absent -
Part D Female
Contraceptive
Prevelance -
Part E Births
in the Last 12
Months -
Part F National
Programme on
Immunization -
Part G Child
Nutrition
Breast Feeding
Module -
Part H Deaths
in the Last 12
Months -
Part I Health
for all Persons
in the
Household -
Part J
Household
Enterprise
State code (State)
Data file: Part D Female Contraceptive Prevelance
Overview
Valid:
60189
Valid (weighted):
60907737.23
Invalid:
0
Invalid (weighted):
0
Minimum:
1
Maximum:
37
Mean:
18.838
Mean (weighted):
18.442
Standard deviation:
10.398
Type:
Discrete
Decimal:
0
Start:
1
End:
2
Width:
2
Range:
1 - 37
Format:
Numeric
Weighted variable:
V2910
Questions and instructions
Literal question
The state by state of the data.
Categories
| Value | Category | Cases | Weighted | |
|---|---|---|---|---|
| 1 | Abia | 1500 | 944619 |
1.6%
|
| 2 | Adamawa | 1847 | 1707194 |
2.8%
|
| 3 | Akwa ibom | 1874 | 1833776 |
3%
|
| 4 | Anambra | 1273 | 1010378 |
1.7%
|
| 5 | Bauchi | 1873 | 2405798 |
3.9%
|
| 6 | Bayelsa | 768 | 758779 |
1.2%
|
| 7 | Benue | 1881 | 2245063 |
3.7%
|
| 8 | Borno | 1476 | 1835658 |
3%
|
| 9 | Cross_rivers | 1418 | 1245080 |
2%
|
| 10 | Delta | 1295 | 1342302 |
2.2%
|
| 11 | Ebonyi | 1952 | 1473879 |
2.4%
|
| 12 | Edo | 1457 | 1161684 |
1.9%
|
| 13 | Ekiti | 1302 | 518614 |
0.9%
|
| 14 | Enugu | 1500 | 1237399 |
2%
|
| 15 | Gombe | 1749 | 1182665 |
1.9%
|
| 16 | Imo | 1874 | 1647358 |
2.7%
|
| 17 | Jigawa | 1782 | 1780689 |
2.9%
|
| 18 | Kaduna | 3187 | 5985282 |
9.8%
|
| 19 | Kano | 1854 | 4578882 |
7.5%
|
| 20 | Katsina | 1648 | 2967246 |
4.9%
|
| 21 | Kebbi | 3087 | 2282836 |
3.7%
|
| 22 | Kogi | 1408 | 935813 |
1.5%
|
| 23 | Kwara | 1327 | 931436 |
1.5%
|
| 24 | Lagos | 1500 | 2521208 |
4.1%
|
| 25 | Nassarawa | 1781 | 949086 |
1.6%
|
| 26 | Niger | 1326 | 1450253 |
2.4%
|
| 27 | Ogun | 1226 | 1007027 |
1.7%
|
| 28 | Ondo | 1342 | 1084115 |
1.8%
|
| 29 | Osun | 1255 | 1155160 |
1.9%
|
| 30 | Oyo | 1433 | 2113555 |
3.5%
|
| 31 | Plateau | 1813 | 1473351 |
2.4%
|
| 32 | Rivers | 1684 | 2020816 |
3.3%
|
| 33 | Sokoto | 1512 | 1339650 |
2.2%
|
| 34 | Taraba | 1305 | 730951 |
1.2%
|
| 35 | Yobe | 1542 | 1194978 |
2%
|
| 36 | Zamfara | 1515 | 1112714 |
1.8%
|
| 37 | Fct | 1623 | 742446 |
1.2%
|
Warning: these figures indicate the number of cases found in the data file. They cannot be interpreted as summary statistics of the population of interest.
Description
Definition
The State and the code.
01 Abia
02 Adamawa
03 Akwa ibom
04 Anambra
05 Bauchi
06 Bayelsa
07 Benue
08 Borno
09 Cross_rivers
10 Delta
11 Ebonyi
12 Edo
13 Ekiti
14 Enugu
15 Gombe
16 Imo
17 Jigawa
18 Kaduna
19 Kano
20 Katsina
21 Kebbi
22 Kogi
23 Kwara
24 Lagos
25 Nassarawa
26 Niger
27 Ogun
28 Ondo
29 Osun
30 Oyo
31 Plateau
32 Rivers
33 Sokoto
34 Taraba
35 Yobe
36 Zamfara
37 FCT
