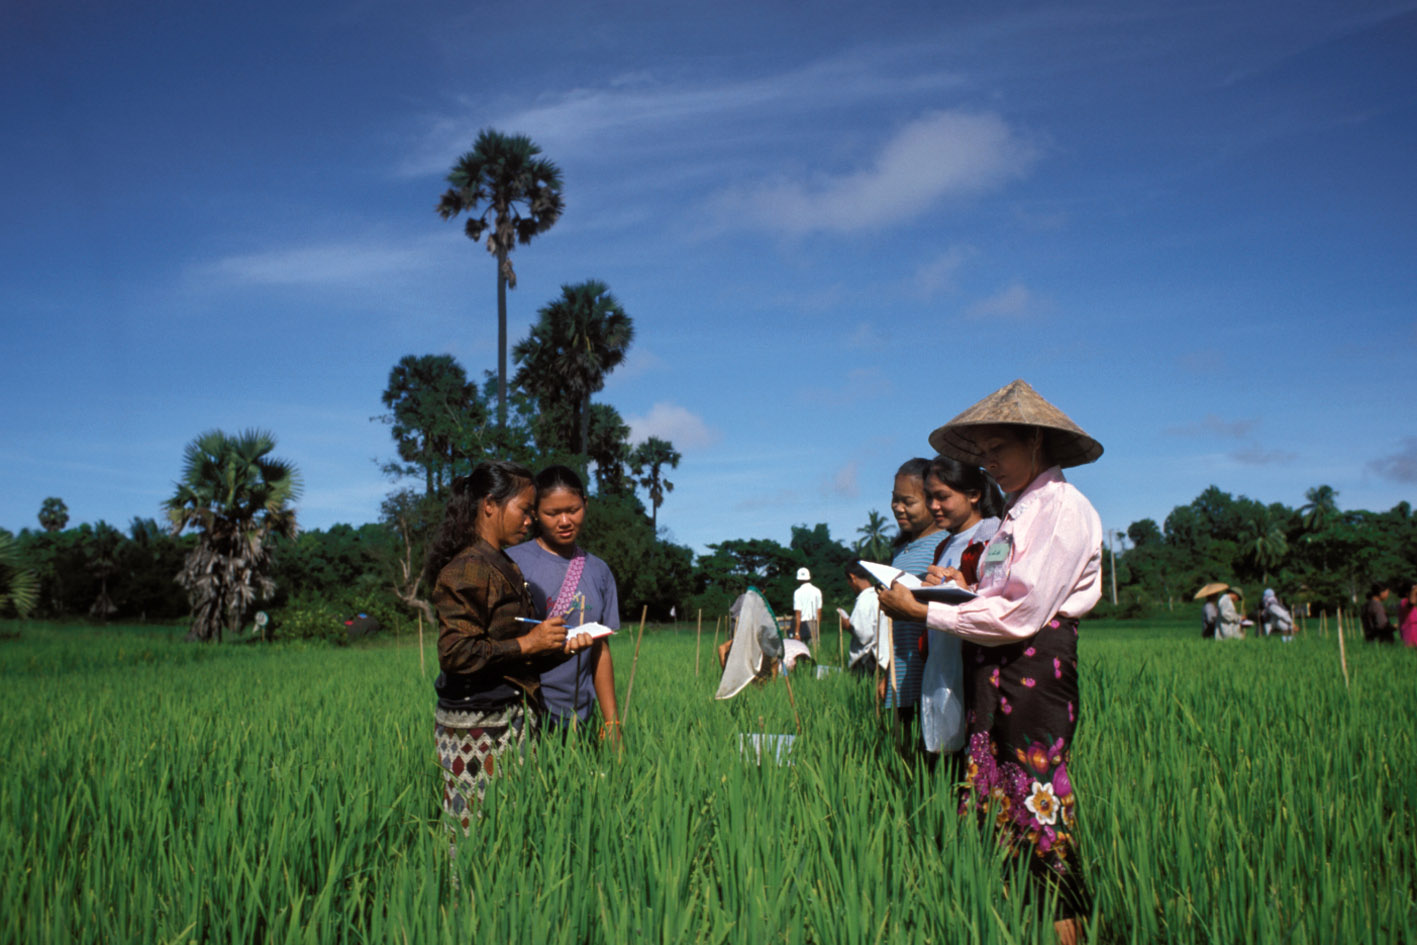
General Household Survey, 2007
Nigeria, 2008
Get Microdata
Reference ID
NGA_2007_GHS_v01_EN_M_v01_A_OCS
Producer(s)
National Bureau of Statistics (NBS)
Collections
Metadata
Created on
Mar 30, 2021
Last modified
Mar 30, 2021
Page views
19385
Downloads
330
- Data files
-
Part K
Household
Expenditure -
Part A
Identification -
Part C Usual
Residence
Absent -
Part D Female
Contraceptive
Prevelance -
Part E Births
in the Last 12
Months -
Part G Child
Nutrition
Breast Feeding
Module -
Part H Deaths
in the Last 12
Months -
Part I Health
for all Persons
in the
Household -
Part J
Household
Enterprises -
Part F National
Programme on
Immunization -
Part B Persons
in the
Household
State code (State)
Data file: Part K Household Expenditure
Overview
Valid:
11784
Valid (weighted):
19350733.009
Invalid:
0
Invalid (weighted):
0
Type:
Discrete
Decimal:
0
Start:
1
End:
2
Width:
2
Range:
1 - 37
Format:
Numeric
Weighted variable:
V972
Questions and instructions
Categories
| Value | Category | Cases | Weighted | |
|---|---|---|---|---|
| 1 | Abia | 156 | 274841 |
1.4%
|
| 2 | Adamawa | 570 | 649335 |
3.4%
|
| 3 | Akwa ibom | 233 | 417058 |
2.2%
|
| 4 | Anambra | 389 | 977013 |
5%
|
| 5 | Bauchi | 224 | 868391 |
4.5%
|
| 6 | Bayelsa | 289 | 308172 |
1.6%
|
| 7 | Benue | 230 | 480374 |
2.5%
|
| 8 | Borno | 134 | 235035 |
1.2%
|
| 9 | Cross_rivers | 478 | 534064 |
2.8%
|
| 10 | Delta | 257 | 600331 |
3.1%
|
| 11 | Ebonyi | 478 | 388825 |
2%
|
| 12 | Edo | 546 | 791642 |
4.1%
|
| 13 | Ekiti | 250 | 350940 |
1.8%
|
| 14 | Enugu | 373 | 546118 |
2.8%
|
| 15 | Gombe | 60 | 205014 |
1.1%
|
| 16 | Imo | 316 | 551455 |
2.8%
|
| 17 | Jigawa | 274 | 391527 |
2%
|
| 18 | Kaduna | 236 | 479633 |
2.5%
|
| 19 | Kano | 192 | 515888 |
2.7%
|
| 20 | Katsina | 525 | 975752 |
5%
|
| 21 | Kebbi | 505 | 566255 |
2.9%
|
| 22 | Kogi | 308 | 555645 |
2.9%
|
| 23 | Kwara | 357 | 426915 |
2.2%
|
| 24 | Lagos | 197 | 1073435 |
5.5%
|
| 25 | Nassarawa | 300 | 414053 |
2.1%
|
| 26 | Niger | 287 | 476410 |
2.5%
|
| 27 | Ogun | 238 | 540797 |
2.8%
|
| 28 | Ondo | 275 | 496133 |
2.6%
|
| 29 | Osun | 258 | 587380 |
3%
|
| 30 | Oyo | 192 | 614564 |
3.2%
|
| 31 | Plateau | 321 | 406395 |
2.1%
|
| 32 | Rivers | 266 | 746379 |
3.9%
|
| 33 | Sokoto | 505 | 698667 |
3.6%
|
| 34 | Taraba | 517 | 464221 |
2.4%
|
| 35 | Yobe | 384 | 346233 |
1.8%
|
| 36 | Zamfara | 316 | 308902 |
1.6%
|
| 37 | Fct | 348 | 86941 |
0.4%
|
Warning: these figures indicate the number of cases found in the data file. They cannot be interpreted as summary statistics of the population of interest.
