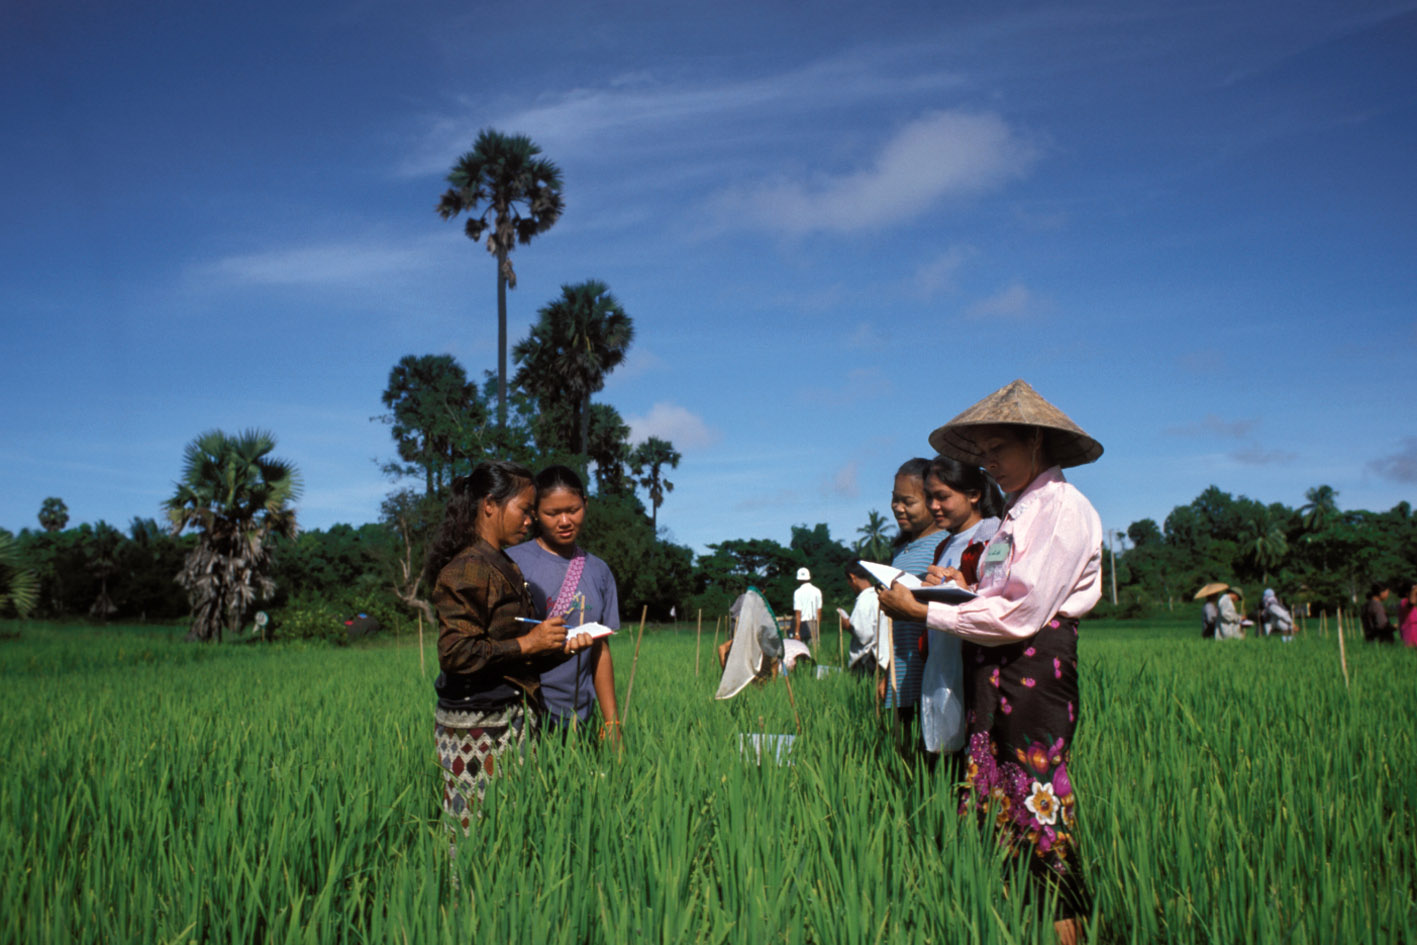
Cambodia Socio-Economic Survey 2011
Cambodia, 2011
Get Microdata
Reference ID
KHM_2011_CSES_v01_EN_M_v01_A_OCS
Producer(s)
National Institute of Statistics
Collections
Metadata
Created on
Apr 08, 2021
Last modified
Jan 25, 2023
Page views
46751
Downloads
494
- Data files
- 11dy_expenditure
- 11dy_income
- construction
- costcultivationcrops
- durablegoods
- fishcultivation1
- fishcultivation2
- fishcultivation3
- foodconsumption
- forestryhunting1
- forestryhunting2
- hhmembers
- housing
- incomeothersource
- inventorycrops
- landownership
- liabilities
- livestock1
- livestock2
- nonagriculture1
- nonagriculture2
- nonagriculture3
- otherinfo
- persondisability
- personecocurrent
- personecousual
- personeducation
- personhealthu2
- personillness
- personmaternalhealth
- personmigrationcurrent
- personmigrationpast
- personpresence
- personviolencea
- personviolenceb
- productioncrops
- psulisting
- recallnonfood
- salescrops
- vulnerability
- weighthouseholds
- weightpersons
Cost item (q05h2c01)
Data file: nonagriculture2
Overview
Valid:
5688
Invalid:
0
Minimum:
1
Maximum:
19
Mean:
8.548
Type:
Discrete
Decimal:
0
Start:
8
End:
9
Width:
2
Range:
1 - 18
Format:
Numeric
Questions and instructions
Literal question
Cost number
Categories
| Value | Category | Cases | |
|---|---|---|---|
| 1 | Raw material used for processing | 256 |
4.5%
|
| 2 | Materials used for construction | 49 |
0.9%
|
| 3 | Fuels used for production or generation of electricity, service etc. | 537 |
9.4%
|
| 4 | Lubricants | 543 |
9.5%
|
| 5 | Purchase of goods for resale | 775 |
13.6%
|
| 6 | Food, drink and tobacco products served to customers | 51 |
0.9%
|
| 7 | Electricity purchased | 231 |
4.1%
|
| 8 | Water and sanitation charges | 225 |
4%
|
| 9 | Containers, packing materials | 840 |
14.8%
|
| 10 | Freight and transport expenses | 349 |
6.1%
|
| 11 | Insurance, bank charges, telephone, postage and other communication | 375 |
6.6%
|
| 12 | Office suplies, stationary and other items | 35 |
0.6%
|
| 13 | Rents paid for land, buildings, storage, warehousing, equipment & machines | 129 |
2.3%
|
| 14 | Repair/maintenance of buildings, equipment & machinery/material/services | 476 |
8.4%
|
| 15 | Registration and other govt. fees, taxes and donations | 527 |
9.3%
|
| 16 | Wages/salaries of hired labour (cash plus kind) | 88 |
1.5%
|
| 17 | Services rendered by others (commissions, etc.) | 52 |
0.9%
|
| 18 | All other expenses not included in the list from 1 to 17 | 99 |
1.7%
|
| 19 | 51 |
0.9%
|
Warning: these figures indicate the number of cases found in the data file. They cannot be interpreted as summary statistics of the population of interest.
Description
Universe
Households with any member who ran business/enterprise during the past 12 months
