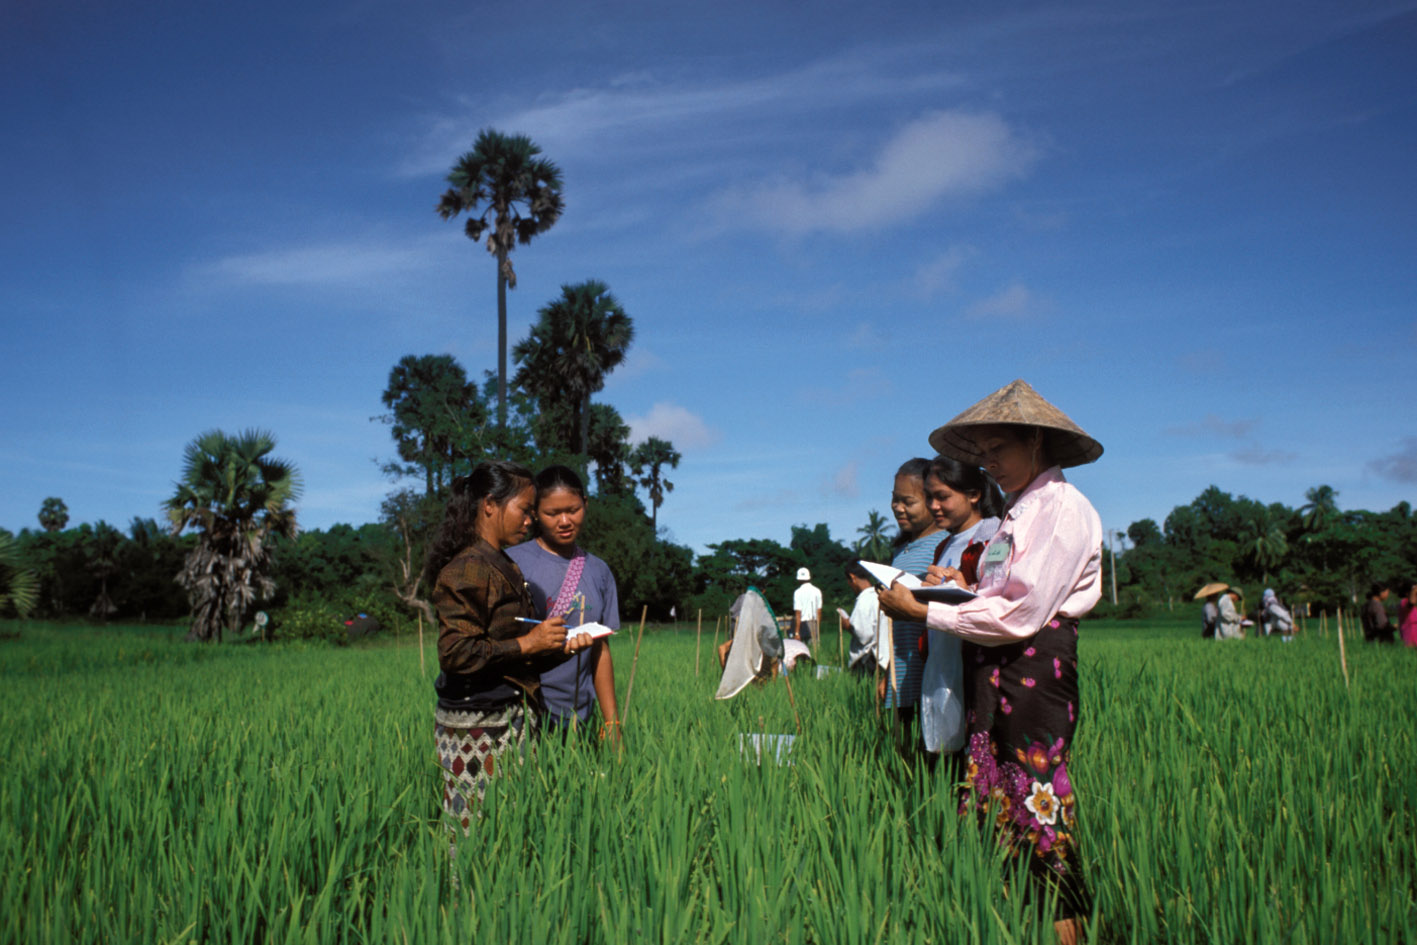
National Survey of Agricultural Export Commodities 2007
Nigeria, 2007
Get Microdata
Reference ID
NGA_2007_NSAEC_v01_EN_M_v01_A_OCS
Producer(s)
National Bureau of Statistics (NBS)
Collections
Metadata
Created on
Jul 15, 2019
Last modified
Jul 15, 2019
Page views
80230
Downloads
3967
- Data files
- Identification
-
Household
Xteristics - Source of Funds
- Cultivated
- Production
- Farm Implements
- Employment
- Market Channel
- Annual Sales
- Farmgate Prices
- Open Market
- Consumption
- Fertilizer
-
Fertilizer
Reasons - Fertilizer Cost
- Nofarm
- Pesticide
-
Pesticide
Reasons - Pesticide Cost
- Improved
- Seedling
-
Seedling
Reasons
State (State)
Data file: Source of Funds
Overview
Valid:
25439
Valid (weighted):
11733602.007
Invalid:
0
Invalid (weighted):
0
Minimum:
1
Maximum:
37
Type:
Discrete
Decimal:
0
Start:
1
End:
2
Width:
2
Range:
1 - 37
Format:
Numeric
Weighted variable:
V1841
Questions and instructions
Literal question
The state by state of the data.
Categories
| Value | Category | Cases | Weighted | |
|---|---|---|---|---|
| 1 | Abia | 1057 | 339571 |
2.9%
|
| 2 | Adamawa | 292 | 280687 |
2.4%
|
| 3 | Akwa-ibom | 349 | 312007 |
2.7%
|
| 4 | Anambra | 609 | 527625 |
4.5%
|
| 5 | Bauchi | 331 | 210758 |
1.8%
|
| 6 | Bayelsa | 239 | 60064 |
0.5%
|
| 7 | Benue | 2748 | 1388360 |
11.8%
|
| 8 | Borno | 301 | 196079 |
1.7%
|
| 9 | Cross river | 356 | 125530 |
1.1%
|
| 10 | Delta | 397 | 213992 |
1.8%
|
| 11 | Eboyin | 1054 | 300658 |
2.6%
|
| 12 | Edo | 407 | 146558 |
1.2%
|
| 13 | Ekiti | 962 | 107318 |
0.9%
|
| 14 | Enugu | 671 | 296505 |
2.5%
|
| 15 | Gombe | 326 | 115525 |
1%
|
| 16 | Imo | 445 | 457400 |
3.9%
|
| 17 | Jigawa | 657 | 276506 |
2.4%
|
| 18 | Kaduna | 392 | 477006 |
4.1%
|
| 19 | Kano | 248 | 787248 |
6.7%
|
| 20 | Katsina | 832 | 444356 |
3.8%
|
| 21 | Kebbi | 273 | 111738 |
1%
|
| 22 | Kogi | 1740 | 380429 |
3.2%
|
| 23 | Kwara | 1305 | 447082 |
3.8%
|
| 24 | Lagos | 79 | 26292 |
0.2%
|
| 25 | Nasarawa | 1324 | 560152 |
4.8%
|
| 26 | Niger | 646 | 437860 |
3.7%
|
| 27 | Ogun | 812 | 230769 |
2%
|
| 28 | Ondo | 1193 | 238152 |
2%
|
| 29 | Osun | 621 | 211949 |
1.8%
|
| 30 | Oyo | 675 | 212669 |
1.8%
|
| 31 | Plateau | 629 | 699424 |
6%
|
| 32 | Rivers | 390 | 300103 |
2.6%
|
| 33 | Sokoto | 289 | 168321 |
1.4%
|
| 34 | Taraba | 295 | 146617 |
1.2%
|
| 35 | Yobe | 369 | 96841 |
0.8%
|
| 36 | Zamfara | 1169 | 291635 |
2.5%
|
| 37 | Fct abuja | 957 | 109819 |
0.9%
|
Warning: these figures indicate the number of cases found in the data file. They cannot be interpreted as summary statistics of the population of interest.
