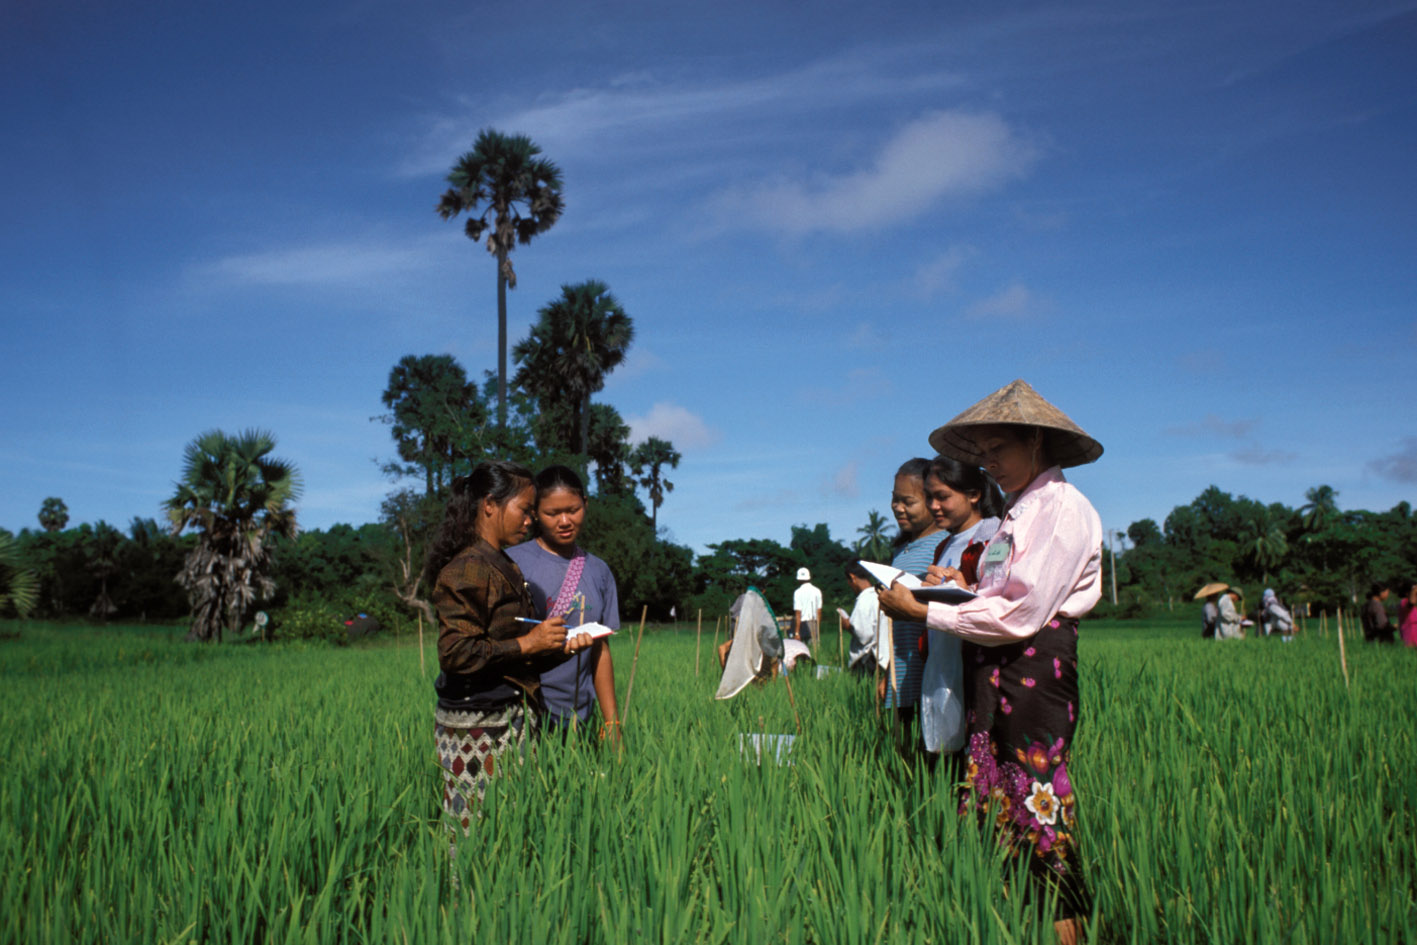
National Survey of Agricultural Export Commodities 2007
Nigeria, 2007
Get Microdata
Reference ID
NGA_2007_NSAEC_v01_EN_M_v01_A_OCS
Producer(s)
National Bureau of Statistics (NBS)
Collections
Metadata
Created on
Jul 15, 2019
Last modified
Jul 15, 2019
Page views
77432
Downloads
3901
- Data files
- Identification
-
Household
Xteristics - Source of Funds
- Cultivated
- Production
- Farm Implements
- Employment
- Market Channel
- Annual Sales
- Farmgate Prices
- Open Market
- Consumption
- Fertilizer
-
Fertilizer
Reasons - Fertilizer Cost
- Nofarm
- Pesticide
-
Pesticide
Reasons - Pesticide Cost
- Improved
- Seedling
-
Seedling
Reasons
State (State)
Data file: Market Channel
Overview
Valid:
27840
Valid (weighted):
13182859.968
Invalid:
0
Invalid (weighted):
0
Minimum:
1
Maximum:
37
Type:
Discrete
Decimal:
0
Start:
1
End:
2
Width:
2
Range:
1 - 37
Format:
Numeric
Weighted variable:
V1736
Questions and instructions
Literal question
The state by state of the data.
Categories
| Value | Category | Cases | Weighted | |
|---|---|---|---|---|
| 1 | Abia | 1241 | 398722 |
3%
|
| 2 | Adamawa | 322 | 305724 |
2.3%
|
| 3 | Akwa-ibom | 617 | 540664 |
4.1%
|
| 4 | Anambra | 658 | 557157 |
4.2%
|
| 5 | Bauchi | 377 | 239679 |
1.8%
|
| 6 | Bayelsa | 281 | 76221 |
0.6%
|
| 7 | Benue | 1721 | 870799 |
6.6%
|
| 8 | Borno | 278 | 183897 |
1.4%
|
| 9 | Cross river | 544 | 194794 |
1.5%
|
| 10 | Delta | 295 | 155843 |
1.2%
|
| 11 | Eboyin | 1612 | 464122 |
3.5%
|
| 12 | Edo | 530 | 191070 |
1.4%
|
| 13 | Ekiti | 842 | 100611 |
0.8%
|
| 14 | Enugu | 1575 | 699725 |
5.3%
|
| 15 | Gombe | 376 | 141517 |
1.1%
|
| 16 | Imo | 500 | 464896 |
3.5%
|
| 17 | Jigawa | 884 | 363587 |
2.8%
|
| 18 | Kaduna | 771 | 971373 |
7.4%
|
| 19 | Kano | 331 | 1127753 |
8.6%
|
| 20 | Katsina | 1253 | 692691 |
5.3%
|
| 21 | Kebbi | 334 | 130897 |
1%
|
| 22 | Kogi | 1641 | 381887 |
2.9%
|
| 23 | Kwara | 767 | 379908 |
2.9%
|
| 24 | Lagos | 64 | 21346 |
0.2%
|
| 25 | Nasarawa | 997 | 325548 |
2.5%
|
| 26 | Niger | 630 | 434235 |
3.3%
|
| 27 | Ogun | 803 | 232545 |
1.8%
|
| 28 | Ondo | 1950 | 410903 |
3.1%
|
| 29 | Osun | 998 | 363426 |
2.8%
|
| 30 | Oyo | 891 | 286534 |
2.2%
|
| 31 | Plateau | 434 | 407502 |
3.1%
|
| 32 | Rivers | 310 | 227557 |
1.7%
|
| 33 | Sokoto | 387 | 241102 |
1.8%
|
| 34 | Taraba | 289 | 142396 |
1.1%
|
| 35 | Yobe | 441 | 119733 |
0.9%
|
| 36 | Zamfara | 1108 | 255380 |
1.9%
|
| 37 | Fct abuja | 788 | 81119 |
0.6%
|
Warning: these figures indicate the number of cases found in the data file. They cannot be interpreted as summary statistics of the population of interest.
