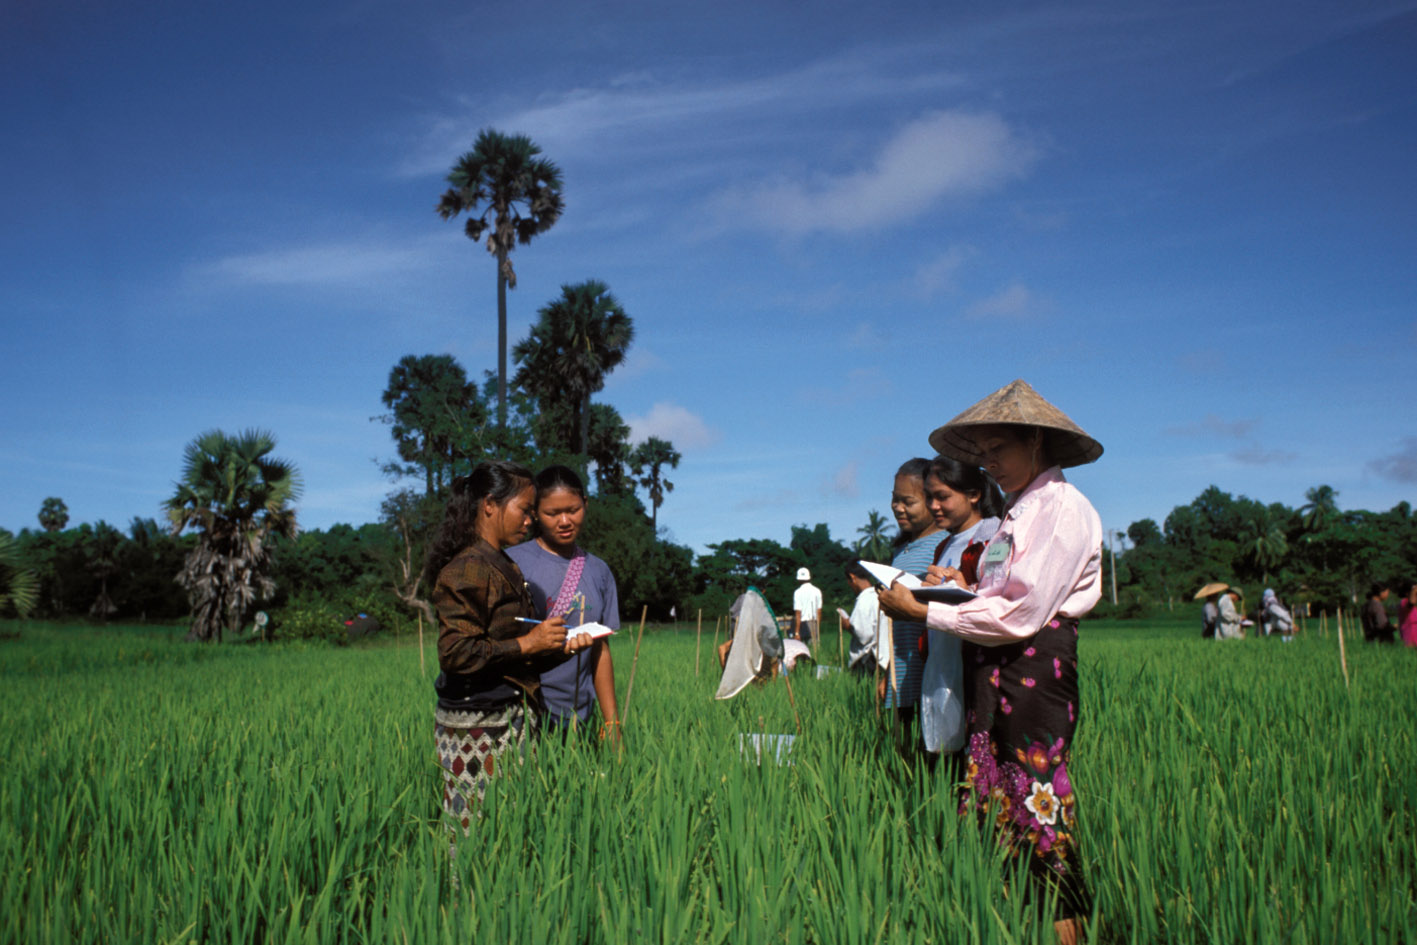
Living Standards Survey 1992-1993
Viet Nam, 1992 - 1993
Get Microdata
Reference ID
VNM_1992-1993_LSS-W1_v01_EN_M_v01_A_OCS
Producer(s)
General Statistical Office (GSO), State Planning Committee (SPC)
Collections
Metadata
Created on
Oct 15, 2020
Last modified
Nov 08, 2022
Page views
90815
Downloads
570
- Data files
- HHEXPEND
- SECT00A
- SECT00B
- SECT01A
- SECT01B
- SECT01C
- SECT02
- SECT03
- SECT04A
- SECT04B
- SECT04C
- SECT04D
- SECT04E
- SECT04F
- SECT04G
- SECT04H
- SECT05A
- SECT06
- SECT07
- SECT08
- SECT08A
- SECT08B
- SECT09
- SECT09A0
- SECT09A1
- SECT09A2
- SECT09A3
- SECT09A4
- SECT09A5
- SECT09A6
- SECT09B1
- SECT09B2
- SECT09B3
- SECT09B4
- SECT09B5
- SECT09B6
- SECT09C
- SECT09D1
- SECT09D2
- SECT09D3
- SECT09D4
- SECT09D5
- SECT09D6
- SECT09D7
- SECT09D8
- SECT09D9
- SECT09E1
- SECT09F1
- SECT09G
- SECT09H
- SECT09J
- SECT09L
- SECT10
- SECT10B
- SECT10D
- SECT11A
- SECT11B
- SECT12A
- SECT12B
- SECT12C
- SECT12D
- SECT13A
- SECT13B
- SECT14A
- SECT14B
- SECT14C
- SECT15
- SECTSKIP
- COMCROP
- COMCULT
- COMGENL
- COMGOV
- COMHLTH
- COMINTV
- COMLAND
- COMLNDQ
- COMSCH
- PRICE0
- PRICE1
S5Q06A:CODE FOR TYPE OF CULTIVA (flandt)
Data file: COMCULT
Overview
Valid:
641
Invalid:
0
Type:
Discrete
Decimal:
0
Start:
9
End:
9
Width:
1
Range:
1 - 9
Format:
Numeric
Questions and instructions
Categories
| Value | Category | Cases | |
|---|---|---|---|
| 1 | Rice | 117 |
18.3%
|
| 2 | Other staples | 102 |
15.9%
|
| 3 | Other food crops | 69 |
10.8%
|
| 4 | Annual industrial crops | 67 |
10.5%
|
| 5 | Other annual crops | 35 |
5.5%
|
| 6 | Industrial tree crops | 54 |
8.4%
|
| 7 | Fruit tree | 89 |
13.9%
|
| 8 | Forest tree | 60 |
9.4%
|
| 9 | Other tree | 48 |
7.5%
|
Warning: these figures indicate the number of cases found in the data file. They cannot be interpreted as summary statistics of the population of interest.
