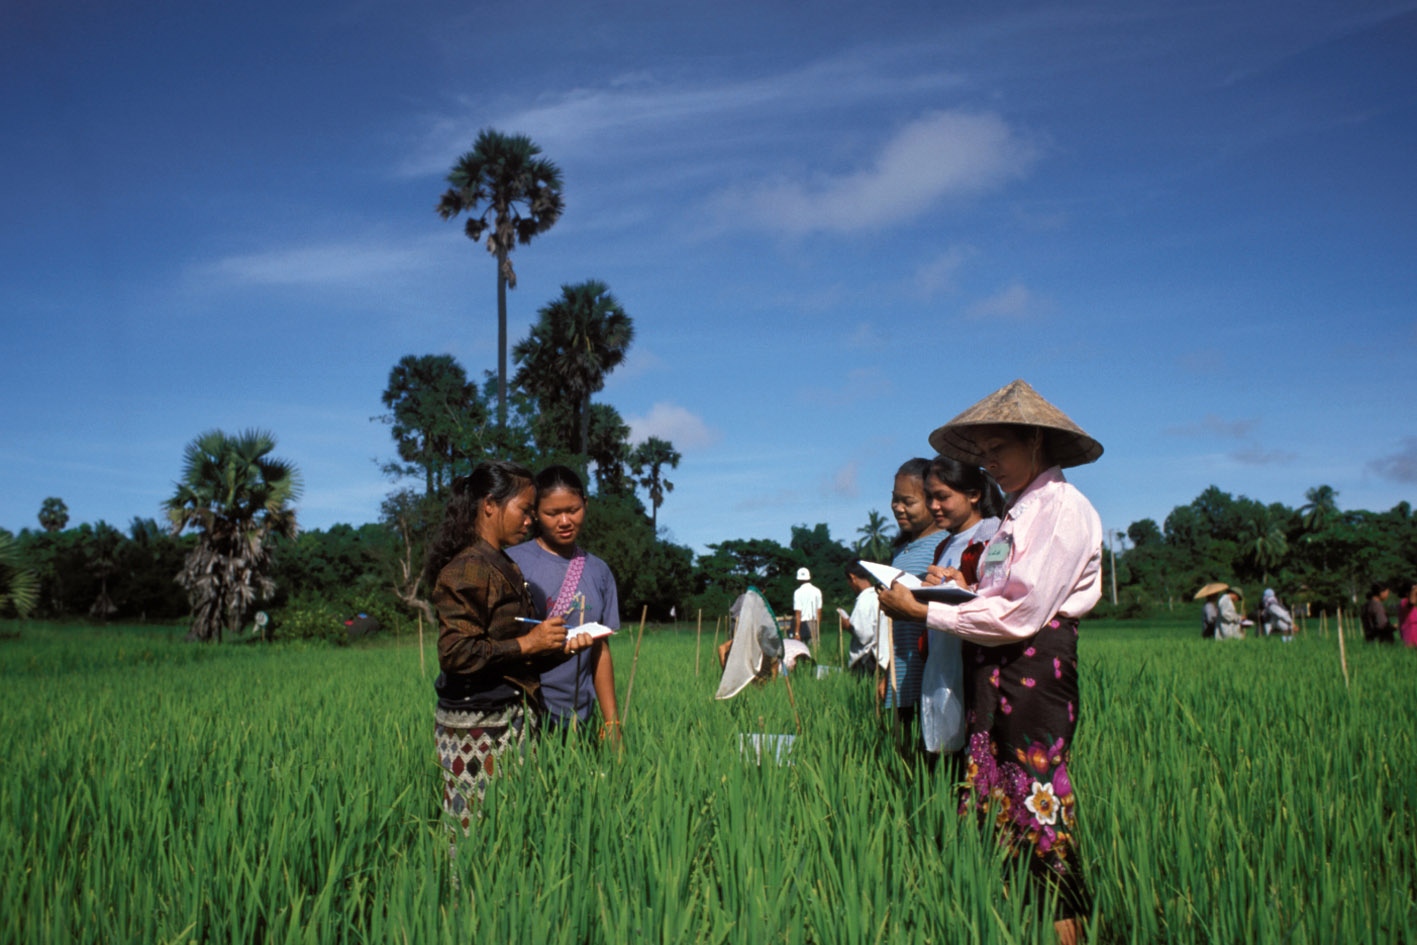
Smallholder Household Survey - CGAP, 2016
Bangladesh, 2016
Get Microdata
Reference ID
BGD_2016_SHS_v01_EN_M_v01_A_OCS
Producer(s)
Jamie Anderson
Collections
Metadata
Created on
Oct 20, 2020
Last modified
Nov 08, 2022
Page views
80939
Downloads
354
I9. District (I9)
Data file: cgap_national_survey_of_sh_hh_bgd_data_set_multiple_26_oct_16
Overview
Valid:
5214
Invalid:
0
Minimum:
1
Maximum:
94
Type:
Discrete
Decimal:
0
Start:
25
End:
26
Width:
2
Range:
1 - 94
Format:
Numeric
Questions and instructions
Categories
| Value | Category | Cases | |
|---|---|---|---|
| 1 | BAGERHAT | 65 |
1.2%
|
| 4 | BARGUNA | 64 |
1.2%
|
| 6 | BARISAL | 141 |
2.7%
|
| 9 | BHOLA | 155 |
3%
|
| 10 | BOGRA | 116 |
2.2%
|
| 12 | BRAHMANBARIA | 37 |
0.7%
|
| 13 | CHANDPUR | 74 |
1.4%
|
| 15 | CHITTAGONG | 188 |
3.6%
|
| 18 | CHUADANGA | 66 |
1.3%
|
| 19 | COMILLA | 157 |
3%
|
| 22 | COX'S BAZAR | 34 |
0.7%
|
| 26 | DHAKA | 121 |
2.3%
|
| 27 | DINAJPUR | 126 |
2.4%
|
| 29 | FARIDPUR | 38 |
0.7%
|
| 30 | FENI | 45 |
0.9%
|
| 32 | GAIBANDHA | 204 |
3.9%
|
| 33 | GAZIPUR | 63 |
1.2%
|
| 35 | GOPALGANJ | 31 |
0.6%
|
| 36 | HABIGANJ | 106 |
2%
|
| 38 | JOYPURHAT | 46 |
0.9%
|
| 39 | JAMALPUR | 59 |
1.1%
|
| 41 | JESSORE | 104 |
2%
|
| 42 | JHALOKATI | 17 |
0.3%
|
| 44 | JHENAIDAH | 52 |
1%
|
| 46 | KHAGRACHHARI | 0 |
0%
|
| 47 | KHULNA | 70 |
1.3%
|
| 48 | KISHOREGONJ | 91 |
1.7%
|
| 49 | KURIGRAM | 205 |
3.9%
|
| 50 | KUSHTIA | 74 |
1.4%
|
| 51 | LAKSHMIPUR | 76 |
1.5%
|
| 52 | LALMONIRHAT | 50 |
1%
|
| 54 | MADARIPUR | 22 |
0.4%
|
| 55 | MAGURA | 36 |
0.7%
|
| 56 | MANIKGANJ | 62 |
1.2%
|
| 57 | MEHERPUR | 19 |
0.4%
|
| 58 | MAULVIBAZAR | 90 |
1.7%
|
| 59 | MUNSHIGANJ | 29 |
0.6%
|
| 61 | MYMENSINGH | 113 |
2.2%
|
| 64 | NAOGAON | 107 |
2.1%
|
| 65 | NARAIL | 18 |
0.3%
|
| 67 | NARAYANGANJ | 55 |
1.1%
|
| 68 | NARSINGDI | 46 |
0.9%
|
| 69 | NATORE | 66 |
1.3%
|
| 70 | CHAPAI NABABGANJ | 134 |
2.6%
|
| 72 | NETRAKONA | 26 |
0.5%
|
| 73 | NILPHAMARI | 107 |
2.1%
|
| 75 | NOAKHALI | 106 |
2%
|
| 76 | PABNA | 105 |
2%
|
| 77 | PANCHAGARH | 71 |
1.4%
|
| 78 | PATUAKHALI | 102 |
2%
|
| 79 | PIROJPUR | 93 |
1.8%
|
| 81 | RAJSHAHI | 116 |
2.2%
|
| 82 | RAJBARI | 19 |
0.4%
|
| 84 | RANGAMATI | 0 |
0%
|
| 85 | RANGPUR | 141 |
2.7%
|
| 86 | SHARIATPUR | 28 |
0.5%
|
| 87 | SATKHIRA | 104 |
2%
|
| 88 | SIRAJGANJ | 169 |
3.2%
|
| 89 | SHERPUR | 44 |
0.8%
|
| 90 | SUNAMGANJ | 127 |
2.4%
|
| 91 | SYLHET | 158 |
3%
|
| 93 | TANGAIL | 78 |
1.5%
|
| 94 | THAKURGAON | 148 |
2.8%
|
Warning: these figures indicate the number of cases found in the data file. They cannot be interpreted as summary statistics of the population of interest.
