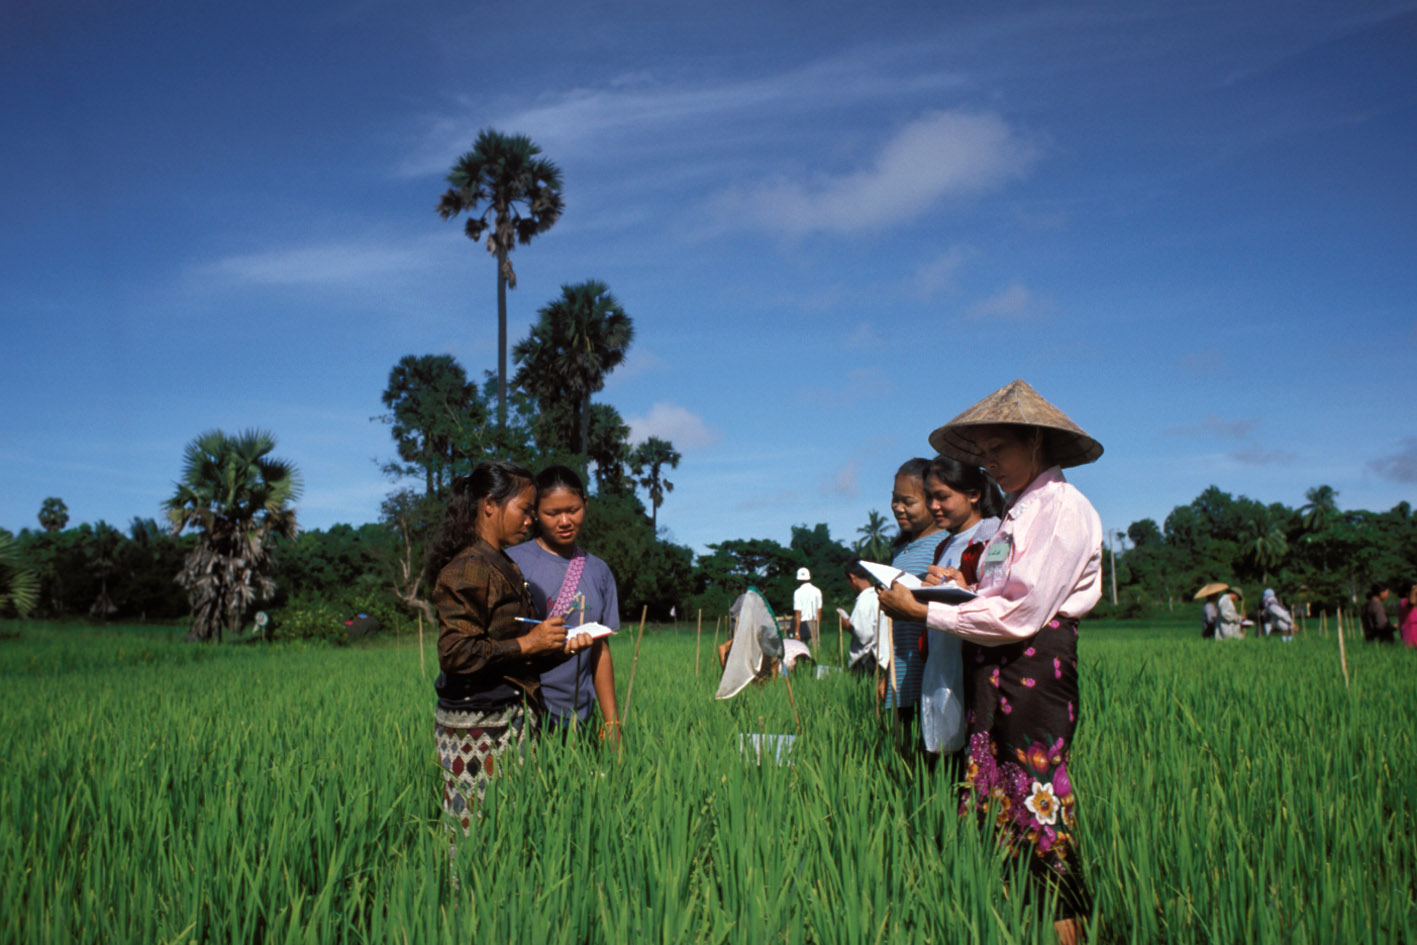
Cambodia Socio-Economic Survey 2012
Cambodia, 2012
Get Microdata
Reference ID
KHM_2012_CSES_v01_EN_M_v01_A_OCS
Producer(s)
National Institute of Statistics
Collections
Metadata
Created on
Apr 08, 2021
Last modified
Jan 25, 2023
Page views
14836
Downloads
148
- Data files
- HHConstruction
- HHCostCultivationCrops
- HHDurableGoods
- HHFishCultivation1
- HHFishCultivation2
- HHFishCultivation3
- HHFoodConsumption
- HHForestryHunting1
- HHForestryHunting2
- HHHousing
- HHIncomeOtherSource
- HHInventoryCrops
- HHLandOwnership
- HHLiabilities
- HHLivestock1
- HHLivestock2
- HHMembers
- HHNonAgriculture1
- HHNonAgriculture2
- HHNonAgriculture3
- HHOtherInfo
- HHProductionCrops
- HHRecallNonFood
- HHSalesCrops
- HHVulnerability
- Households
- PersonDisability
- PersonEcoCurrent
- PersonEducation
- PersonHealthU2
- PersonIllness
- PersonMaternalHealth
- PersonviolenceA
- PersonViolenceB
- PSUListing
- WeightHouseholds
- Weightpersons
Revenue item (Q05H3C01)
Data file: HHNonAgriculture3
Overview
Valid:
2604
Invalid:
0
Minimum:
1
Maximum:
20
Type:
Discrete
Decimal:
0
Start:
8
End:
9
Width:
2
Range:
1 - 20
Format:
Numeric
Questions and instructions
Literal question
Revenue item
Categories
| Value | Category | Cases | |
|---|---|---|---|
| 1 | Receipts from sale of products and by-products | 169 |
6.5%
|
| 2 | Charges for repair services | 85 |
3.3%
|
| 3 | Other professional and service charges and commissions, etc. | 276 |
10.6%
|
| 4 | Charges for construction work done | 32 |
1.2%
|
| 5 | Proceeds from sale of goods sold | 846 |
32.5%
|
| 6 | Charges for board and lodging | 32 |
1.2%
|
| 7 | Receipts from sales/services at hotels/restaurants | 94 |
3.6%
|
| 8 | Charges for transport services provided (taxi, moto etc) | 276 |
10.6%
|
| 9 | Imputed value of products/goods for resale, etc. consumed in the household | 469 |
18%
|
| 10 | Imputed value of products/by-products used as intermediate goods | 27 |
1%
|
| 11 | Imputed value of products/by-products used as gifts, charity, etc. | 58 |
2.2%
|
| 12 | Supply of electricity, gas and water | 24 |
0.9%
|
| 13 | Rental income from land & buildings & storage & warehousing | 30 |
1.2%
|
| 14 | Rental income from equipment and machinery | 28 |
1.1%
|
| 15 | Charges for financial / insurance / real estate services | 26 |
1%
|
| 16 | Charges for medical services | 25 |
1%
|
| 17 | Charges for educational services | 26 |
1%
|
| 18 | Charges for recreational and cultural services | 27 |
1%
|
| 19 | Charges for other community, social and personal services | 25 |
1%
|
| 20 | All other income receipts and charges from the activity not included in (01-19) | 29 |
1.1%
|
Warning: these figures indicate the number of cases found in the data file. They cannot be interpreted as summary statistics of the population of interest.
