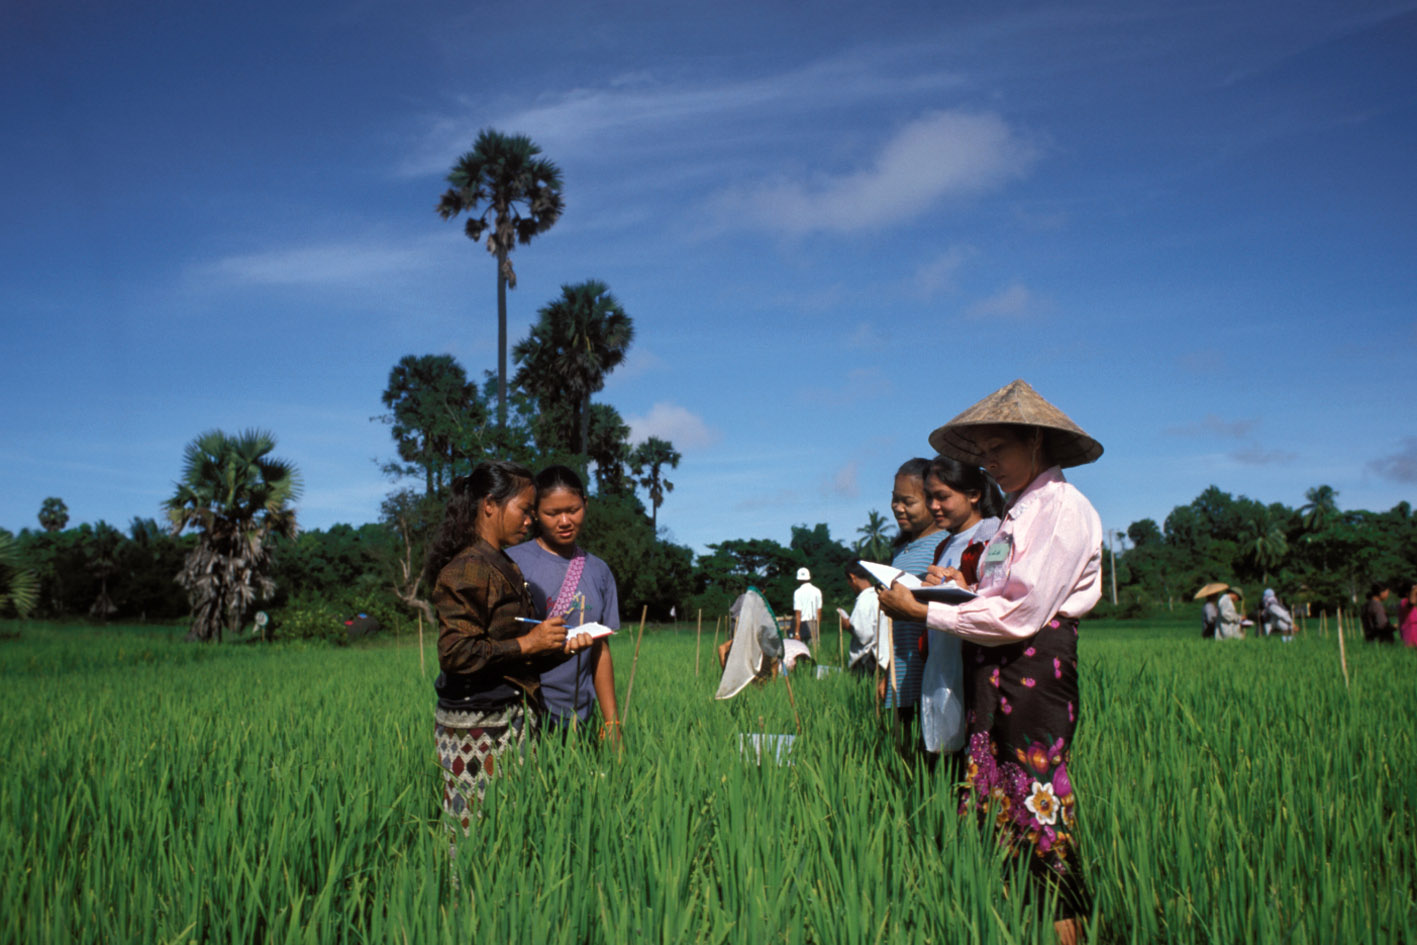
Cambodia Socio-Economic Survey 2010
Cambodia, 2010
Get Microdata
Reference ID
KHM_2010_CSES_v01_EN_M_v01_A_OCS
Producer(s)
National Institute of Statistics
Collections
Metadata
Created on
Apr 08, 2021
Last modified
Jan 25, 2023
Page views
19232
Downloads
584
- Data files
- areainformation
- Diary1_diaryincome
- Diary2_diaryexpenditure
- S01-17_hhotherinfo
- S01A_hhmembers
- S01B_hhfoodconsumption
- S01C_hhrecallnonfood
- S02_personeducation
- S03A_personmigrationpast
- S03B_personmigrationcurrent
- S04_hhhousing
- S05A_hhlandownership
- S05B_hhproductioncrops
- S05C_hhcostcultivationcrops
- S05D_hhinventorycrops
- S05E1_hhlivestock1
- S05E2_hhlivestock2
- S05F1_hhfishcultivation1
- S05F2_hhfishcultivation2
- S05F3_hhfishcultivation3
- S05G_hhforestryhunting2
- S05G2_hhforestryhunting1
- S05H1_hhnonagriculture1
- S05H2_hhnonagriculture2
- S05H3_hhnonagriculture3
- S06_hhliabilities
- S07_hhincomeothersource
- S08_hhconstruction
- S09_hhdurablegoods
- S10_personmaternalhealth
- S11_personhealthu2
- S13_personillness
- S14_persondisability
- S15_personecocurrent
- S16_personecousu
- S17A_personviolencea
- S17B_personviolenceb
- S18_personpresence
- weighthouseholds
- weightpersons
Item number (q01bc01)
Data file: S01B_hhfoodconsumption
Overview
Valid:
45437
Invalid:
0
Minimum:
1
Maximum:
20
Type:
Discrete
Decimal:
0
Start:
8
End:
9
Width:
2
Range:
1 - 20
Format:
Numeric
Questions and instructions
Question pretext
Only expnediture/value of own production for household consumption!
Note that any household's expenditure on economic activity shall not be included in this section, because it will be asked in the sections on the economic activities (Section 5B-H).
For each item group try to estimate quantity of items consumed, and then how much of the consumed quantity had been purchased in cash and how much was from own production or received as payment in kind for work, or as gift, or free collection.
Literal question
FOOD/BEVERAGE/TOBACCO ITEMS
Categories
| Value | Category | Cases | |
|---|---|---|---|
| 1 | Cereals (rice, bread, corn, wheat flour, rice flour, corn meal, rice cakes, noodles, biscuits, etc.) | 3587 |
7.9%
|
| 2 | Fish (fresh fish, salted and dried fish, canned fish, shrimp, prawn, crab, etc.) | 3578 |
7.9%
|
| 3 | Meat & poultry (beef, buffalo, mutton, lamb, pork, chicken, duck, innards, incl liver, spleen, dried beef) | 3384 |
7.4%
|
| 4 | Eggs (chicken egg, duck egg, quail egg, fermented/salted egg, etc.) | 2944 |
6.5%
|
| 5 | Dairy products (fresh milk, condensed or powdered milk, ice cream, cheese, other dairy products, etc.) | 1481 |
3.3%
|
| 6 | Oil and fats (rice bran oil, vegetable oil, pork fat, butter, margarine, coconut/frying oil, etc.) | 3507 |
7.7%
|
| 7 | Fresh vegetables (trakun, onion, shallot, cabbage, spinach, carrot, beans, chilli, tomato, etc.) | 3574 |
7.9%
|
| 8 | Tuber (cassava, sweet potato, potato, traov, sugar beet, etc.) | 1212 |
2.7%
|
| 9 | Pulses and legumes (green gram, dhall, cowpea, bean sprout, other seeds, etc.) | 1514 |
3.3%
|
| 10 | Prepared and preserved vegetables (cucumber pickles, other pickles, tomato paste, etc.) | 2099 |
4.6%
|
| 11 | Fruit (banana, orange, mango, pineapple, lemon, papaya, durian, water melon, grape, apple, canned and dried fruits, etc.) | 2887 |
6.4%
|
| 12 | Dried nuts and edible seeds (coconut, cashew nut, lotus nut, peanut, gourd seed, other nuts) | 1463 |
3.2%
|
| 13 | Sugar, salt and spices (sugar, jaggery, salt, chocolate, candy, coriander, red pepper spice, garlic, ginger, soy sauce, fish sauce, monosodium glutamate, etc.) | 3573 |
7.9%
|
| 14 | Tea, coffee, cocoa | 1268 |
2.8%
|
| 15 | Non-alcoholic beverages (canned or bottled soft drinks, mineral water, fruit juice, fruit syrup, etc.) | 1312 |
2.9%
|
| 16 | Alcoholic beverages (beer, wine, whisky, scotch, other distilled spirits) | 1239 |
2.7%
|
| 17 | Tobacco products (cigarettes, mild tobacco, strong tobacco, etc.) | 1359 |
3%
|
| 18 | Other food products (fried insects, peanut preparation, flavoured ice, ice, other food products) | 1807 |
4%
|
| 19 | Food taken away from home (meals at work, school, restaurants, snacks, coffee, softdrinks purchased outside home) | 2478 |
5.5%
|
| 20 | Prepared meals bought outside and eaten at home | 1171 |
2.6%
|
Warning: these figures indicate the number of cases found in the data file. They cannot be interpreted as summary statistics of the population of interest.
Question post text
FOOD/BVERAGE/TOBACCO ITEMS
Description
Source of information
Household member who knows most about food, beverage, tobacco consumption in the last 7 days
