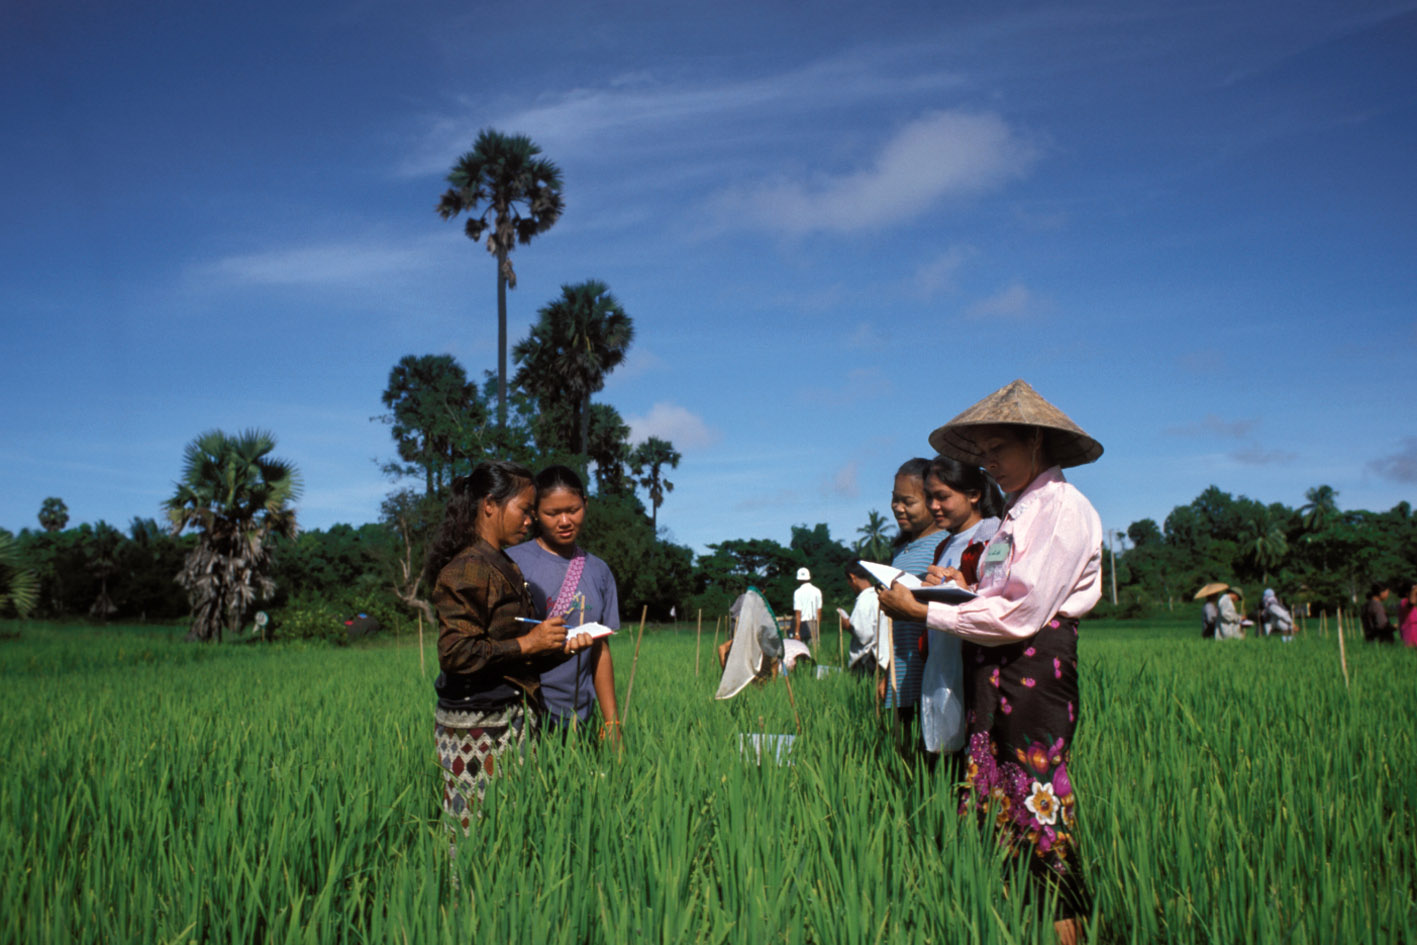
General Household Survey-Panel Wave 3 (Post Harvest) 2015-2016
Nigeria, 2016
Get Microdata
Reference ID
NGA_2015-2016_GHS-W3-PH_v01_EN_M_v01_A_OCS
Producer(s)
National Bureau of Statistics (NBS)
Collections
Metadata
Created on
Jul 17, 2019
Last modified
Jul 17, 2019
Page views
313710
Downloads
5927
- Data files
-
Section
A_Household
Identification -
Section
1_Household
Roster -
Section
2_Education - Section 3_Labor
-
Section
4_Health -
Section
4B_Child
Development -
Section
6_Remittances -
Section
6A_Behavior -
Section
6B_Attitude -
Section 9_Non
Farm
Enterprises and
Income
Generating
Activities -
Section 9B_Non
Farm
Enterprises and
Income
Generating
Activities -
Section
10A_Meal away
from Home -
Section
10B_Food
Expenditure -
Section
10C_Aggregate
Food
Consumption -
Section
10CA_Aggregate
Food
Consumption -
Section
10CB_Aggregate
Food
Consumption -
Section 11A_Non
Food
Expenditure -
Section 11B_Non
Food
Expenditure -
Section 11C_Non
Food
Expenditure -
Section 11D_Non
Food
Expenditure -
Section 11E_Non
Food
Expenditure -
Section 12_Food
Security HH -
Section 13
_Other
household
Income -
Section
14_Safety Nets -
Section
15A_Economic
Shock -
Section
15B1_Death HH -
Section
15B2_Death -
Section
15c_Conflict -
Section A_
Household
Identification
AGRIC - Section A1_Land
-
Section
A2_Labor -
Section
A3i_Crop
Harvest -
Section
A3ii_Crop
Disposition -
Section
A4_Agricultural
Capital -
Section
A5A_Extension
Services -
Section
A5B_Extension
Services -
Section
A8_Other
Agricultural
Income -
Section
A9A_Fishing -
Section
A9A2_Fishing -
Section
A9B1_Fishing
Capital and
Revenue -
Section
A9B2_Fishing
Capital and
Revenue AGRIC -
Section
A9B3_Fishing
Capital and
Revenue -
SectionA10_Network
Roster -
Section_Community
Identification -
Section
C1_Respondent
characteristics -
Section
C2_Community
Infrastructure
and
Transportation -
Section
C3_Community
Organization -
Section
C4_Community
Resource
Management -
Section
C5_Community
Changes -
Section
C6_Community
Key Events -
Section
C6A_Conflict -
Section
C7_Community
needs,actions
and achievement -
Section
C8A_Food Prices
1st Location -
Section C8_Food
Prices 2nd
Location
Interview status after first interview (Saq15a)
Data file: Section A_Household Identification
Overview
Valid:
4571
Invalid:
21
Type:
Discrete
Decimal:
0
Start:
123
End:
124
Width:
2
Range:
0 - 16
Format:
Numeric
Questions and instructions
Literal question
INTERVIEW STATUS AFTER FIRST VISIT
Categories
| Value | Category | Cases | |
|---|---|---|---|
| 0 | 1 |
0%
|
|
| 1 | 1. Cover | 159 |
3.5%
|
| 2 | 2. Section 1 roster | 7 |
0.2%
|
| 3 | 3. Section 2 education | 17 |
0.4%
|
| 4 | 4. Section 3 labour | 35 |
0.8%
|
| 5 | 5. Section 4 health / child development | 46 |
1%
|
| 6 | 6. Section 6 remittances | 149 |
3.3%
|
| 7 | 7. Section 6a/6b behavior / attitude | 91 |
2%
|
| 8 | 8. Section 9 non-farm enterprise | 223 |
4.9%
|
| 9 | 9. Section 10 food expenditure | 257 |
5.6%
|
| 10 | 10. Section 11 non-food expenditure | 137 |
3%
|
| 11 | 11. Section 12 food security | 67 |
1.5%
|
| 12 | 12. Section 13 other household income | 41 |
0.9%
|
| 13 | 13. Section 14 safety nets | 18 |
0.4%
|
| 14 | 14. Section 15 shocks / deaths / conflict | 10 |
0.2%
|
| 15 | 15. Contact info | 912 |
20%
|
| 16 | 16. Agriculture questionnaire | 2401 |
52.5%
|
| Sysmiss | 21 |
Warning: these figures indicate the number of cases found in the data file. They cannot be interpreted as summary statistics of the population of interest.
