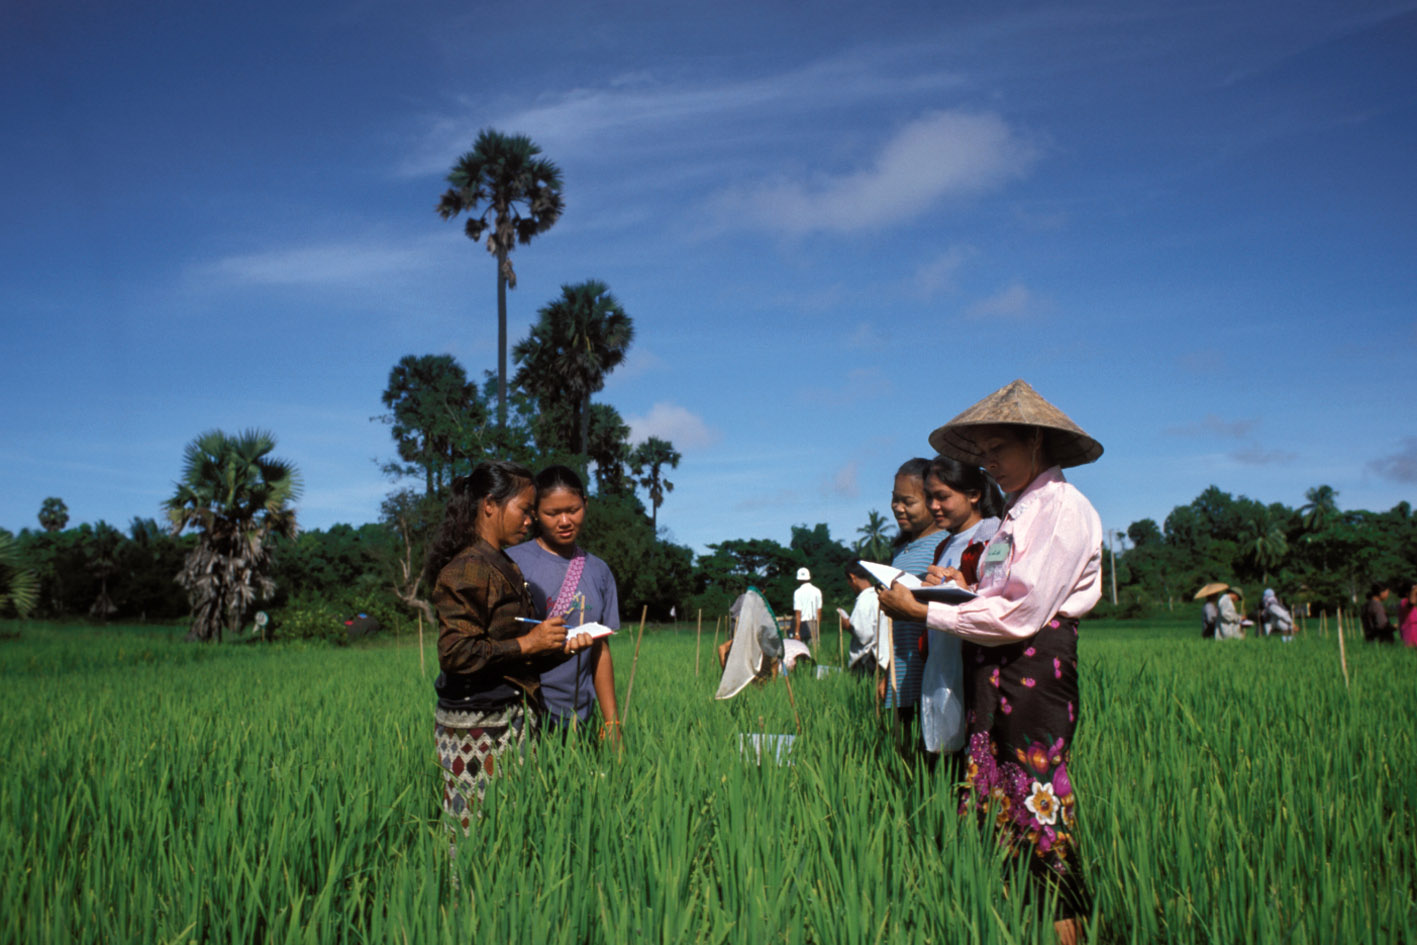
General Household Survey-Panel Wave 3 (Post Harvest) 2015-2016
Nigeria, 2016
Get Microdata
Reference ID
NGA_2015-2016_GHS-W3-PH_v01_EN_M_v01_A_OCS
Producer(s)
National Bureau of Statistics (NBS)
Collections
Metadata
Created on
Jul 17, 2019
Last modified
Jul 17, 2019
Page views
326938
Downloads
6072
- Data files
-
Section
A_Household
Identification -
Section
1_Household
Roster -
Section
2_Education - Section 3_Labor
-
Section
4_Health -
Section
4B_Child
Development -
Section
6_Remittances -
Section
6A_Behavior -
Section
6B_Attitude -
Section 9_Non
Farm
Enterprises and
Income
Generating
Activities -
Section 9B_Non
Farm
Enterprises and
Income
Generating
Activities -
Section
10A_Meal away
from Home -
Section
10B_Food
Expenditure -
Section
10C_Aggregate
Food
Consumption -
Section
10CA_Aggregate
Food
Consumption -
Section
10CB_Aggregate
Food
Consumption -
Section 11A_Non
Food
Expenditure -
Section 11B_Non
Food
Expenditure -
Section 11C_Non
Food
Expenditure -
Section 11D_Non
Food
Expenditure -
Section 11E_Non
Food
Expenditure -
Section 12_Food
Security HH -
Section 13
_Other
household
Income -
Section
14_Safety Nets -
Section
15A_Economic
Shock -
Section
15B1_Death HH -
Section
15B2_Death -
Section
15c_Conflict -
Section A_
Household
Identification
AGRIC - Section A1_Land
-
Section
A2_Labor -
Section
A3i_Crop
Harvest -
Section
A3ii_Crop
Disposition -
Section
A4_Agricultural
Capital -
Section
A5A_Extension
Services -
Section
A5B_Extension
Services -
Section
A8_Other
Agricultural
Income -
Section
A9A_Fishing -
Section
A9A2_Fishing -
Section
A9B1_Fishing
Capital and
Revenue -
Section
A9B2_Fishing
Capital and
Revenue AGRIC -
Section
A9B3_Fishing
Capital and
Revenue -
SectionA10_Network
Roster -
Section_Community
Identification -
Section
C1_Respondent
characteristics -
Section
C2_Community
Infrastructure
and
Transportation -
Section
C3_Community
Organization -
Section
C4_Community
Resource
Management -
Section
C5_Community
Changes -
Section
C6_Community
Key Events -
Section
C6A_Conflict -
Section
C7_Community
needs,actions
and achievement -
Section
C8A_Food Prices
1st Location -
Section C8_Food
Prices 2nd
Location
2nd constraint (S9q29b)
Data file: Section 9B_Non Farm Enterprises and Income Generating Activities
Overview
Valid:
2990
Invalid:
1590
Minimum:
11
Maximum:
132
Type:
Discrete
Decimal:
0
Start:
22
End:
24
Width:
3
Range:
11 - 132
Format:
Numeric
Questions and instructions
Question pretext
List the three most important constraints to non-farm business operations and growth?
Literal question
2ND
Categories
| Value | Category | Cases | |
|---|---|---|---|
| 11 | 11. Electric - access | 50 |
1.7%
|
| 12 | 12. Electric - quality | 73 |
2.4%
|
| 13 | 13. Electric - cost | 63 |
2.1%
|
| 21 | 21. Telecom - access | 19 |
0.6%
|
| 22 | 22. Telecom - quality | 23 |
0.8%
|
| 23 | 23. Telecom - cost | 18 |
0.6%
|
| 31 | 31. Water - access | 38 |
1.3%
|
| 32 | 32. Water - quality | 21 |
0.7%
|
| 33 | 33. Water - cost | 17 |
0.6%
|
| 41 | 41. Postal services - access | 5 |
0.2%
|
| 42 | 42. Postal services - quality | 4 |
0.1%
|
| 43 | 43. Postal services - cost | 3 |
0.1%
|
| 61 | 61. Transportation - road access | 137 |
4.6%
|
| 62 | 62. Transportation - road quality | 183 |
6.1%
|
| 63 | 63. Transportation - road cost | 159 |
5.3%
|
| 64 | 64. Facilities to transport goods | 54 |
1.8%
|
| 71 | 71. Difficulty to borrow from family, friends and others | 381 |
12.7%
|
| 72 | 72. Difficulty to borrow from formal financial institutions | 575 |
19.2%
|
| 73 | 73. High interest rate | 182 |
6.1%
|
| 74 | 74. Complicated bank loan procedures (too many forms) | 46 |
1.5%
|
| 75 | 75. Fear of not being able to pay loan installments | 43 |
1.4%
|
| 81 | 81. Access to markets (distance and costs) | 188 |
6.3%
|
| 82 | 82. Difficult to obtain information on your product market | 60 |
2%
|
| 83 | 83. Low demand for goods and services produced | 311 |
10.4%
|
| 91 | 91. Corruption | 37 |
1.2%
|
| 92 | 92. Uncertain economic policy | 101 |
3.4%
|
| 93 | 93. Restrictive laws and regulations | 23 |
0.8%
|
| 101 | 101. Criminality, thefts and lawlessness | 46 |
1.5%
|
| 102 | 102. Conflicts and social friction | 9 |
0.3%
|
| 111 | 111. Lack of training | 36 |
1.2%
|
| 112 | 112. Research costs | 4 |
0.1%
|
| 113 | 113. Access to computers | 0 |
0%
|
| 114 | 114. Access to information and technology | 7 |
0.2%
|
| 121 | 121. Time and costs of registering enterprise | 4 |
0.1%
|
| 122 | 122. Time and costs of obtaining enterprise permits | 5 |
0.2%
|
| 123 | 123. Complicated enterprise registration and permits regulat | 5 |
0.2%
|
| 131 | 131. High taxes | 36 |
1.2%
|
| 132 | 132. Unofficial levies | 24 |
0.8%
|
| Sysmiss | 1590 |
Warning: these figures indicate the number of cases found in the data file. They cannot be interpreted as summary statistics of the population of interest.
Interviewer instructions
REFER TO CONSTRAINT CODES ON THE RIGHT
Question post text
(GO TO NEXT SECTION)
